The typical online shopper saves $16 per discounted purchase — but at some stores, they save more than they spend. To understand where Americans actually get the best deals online, we analyzed 114,000 real checkout transactions where an exact discount amount was recorded at the point of sale. These aren't theoretical offers or advertised percentages — they're verified dollar amounts captured by affiliate commerce networks when a purchase was completed.
Across every transaction in our dataset, the numbers paint a clear picture:
- The median checkout discount is $16 per order — meaning half of all discounted purchases save less than that, and half save more.
- The average discount is $43 — pulled higher by major big-ticket purchases at electronics and home furnishing retailers.
- The top 25% of transactions saved shoppers $36 or more, and the top 10% saved $83 or more.
- The typical shopper kept about 15% off the pre-discount price at checkout.
But the national median only tells part of the story. The range between retailers is enormous.
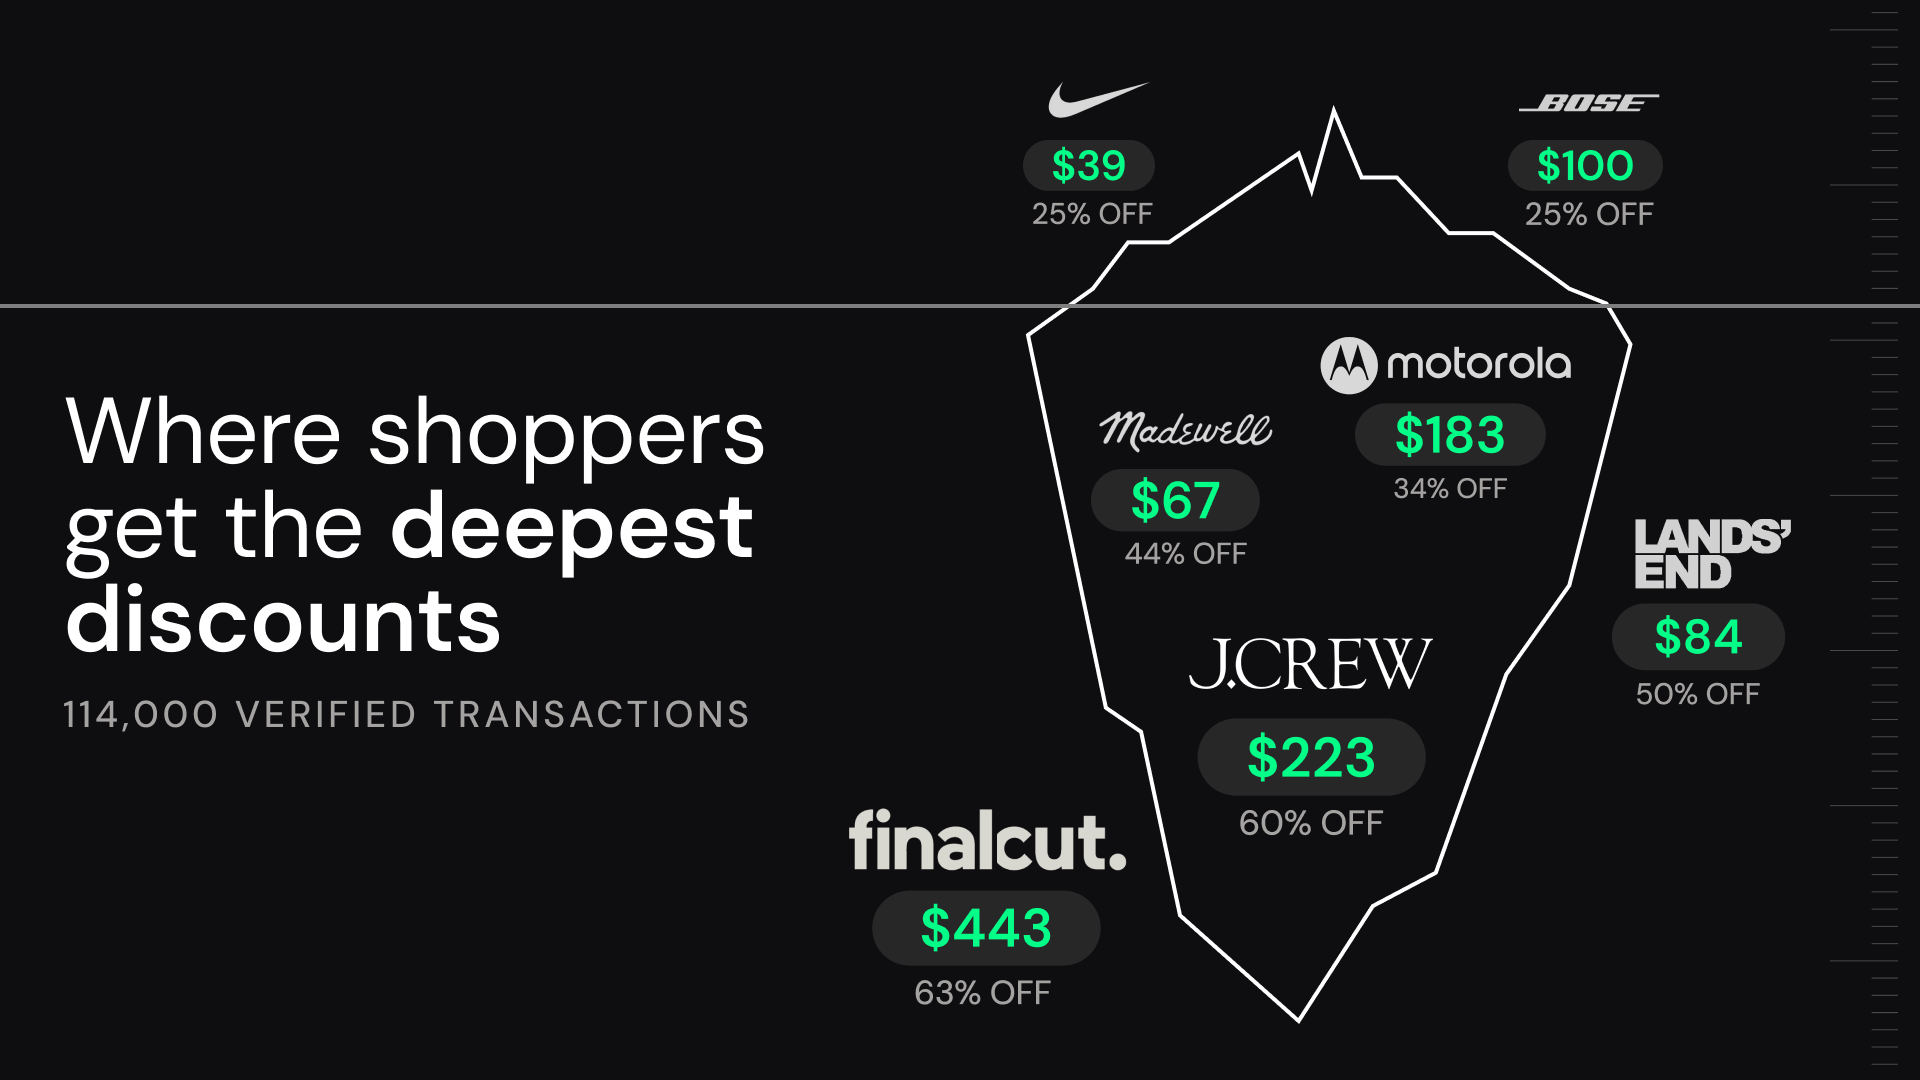
At J. Crew Factory, the typical purchase came with a $148 discount — meaning the median shopper paid $90 and saved $148 on top of that. They saved more than they spent. At Lands' End, shoppers saved $84 on a $94 purchase — nearly a 50/50 split. At Madewell, the typical discount was $68 off a $93 bill (44% off). At Bose, shoppers saved $100 on $249 orders.
On the other end of the spectrum, major retailers like Best Buy offered a typical discount of just $10 on a $266 median purchase (under 4%), and American Eagle shoppers saved a median of just $7 per order.
The gap between the deepest discounters and the stingiest is more than 20x — and it's not always where you'd expect.
The 25 biggest discounters in America
To find which retailers consistently deliver the deepest checkout savings, we ranked over a thousand stores in our dataset by median discount per transaction — the amount a typical shopper saved on a single purchase. We required at least 100 verified transactions per retailer to qualify.
The results reveal a wide gap between the most generous discounters and the rest of the market.
The full estimated savings table for top 25 discount stores
| Store | Category | Typical Discount | The Average Shopper Paid | The Average Original Price | % Off |
|---|---|---|---|---|---|
| FinalCut | Apparel | $443 | $235 | $720 | 63% |
| Mirador Outdoor | Home & Garden | $204 | $1,495 | $1,699 | 12% |
| Motorola | Electronics | $183 | $300 | $470 | 34% |
| J. Crew Factory | Apparel | $147 | $92 | $248 | 62% |
| HBX | Apparel | $145 | $196 | $343 | 40% |
| Sonos | Electronics | $124 | $665 | $767 | 18% |
| LINSY HOME | Home & Garden | $124 | $1,584 | $1,760 | 10% |
| PuroAir | Home & Garden | $119 | $231 | $345 | 39% |
| Luisa Via Roma | Apparel | $111 | $282 | $455 | 31% |
| R13 | Apparel | $105 | $716 | $845 | 10% |
| Bose | Electronics | $100 | $249 | $349 | 25% |
| Lacoste | Apparel | $86 | $110 | $208 | 48% |
| Lands' End | Apparel | $84 | $94 | $185 | 50% |
| SimpleTire | Automotive | $82 | $536 | $681 | 15% |
| Albee Baby | Home & Garden | $80 | $366 | $450 | 19% |
| Madewell | Apparel | $67 | $94 | $163 | 44% |
| Ruggable | Home & Garden | $64 | $332 | $419 | 15% |
| Luvme | Beauty | $62 | $154 | $220 | 28% |
| Todd Snyder | Apparel | $59 | $235 | $298 | 15% |
| Corelle | Home & Garden | $55 | $96 | $162 | 40% |
| Lancôme | Beauty | $52 | $115 | $171 | 30% |
| Schweitzer Linen | Home & Garden | $51 | $256 | $320 | 10% |
| Harry Rosen | Apparel | $50 | $254 | $303 | 19% |
| Pelican | Travel | $50 | $289 | $343 | 15% |
| Private MD Labs | Health | $49 | $190 | $244 | 18% |
What the data reveals
Two types of discounters emerge. The top 25 splits cleanly into two groups: high-percentage discounters where the markdown itself is the main story, and high-ticket discounters where even a modest percentage translates into significant dollars.
In the first group, retailers like J. Crew Factory (62% off), FinalCut (63%), Lands' End (50%), Lacoste (48%), and Madewell (44%) are slashing prices nearly in half. A J. Crew Factory shopper picking up a $248 item typically paid just $92. These are the stores where the discount fundamentally changes the economics of the purchase.
In the second group, retailers like Sonos, Mirador Outdoor, and LINSY HOME offer more modest percentage discounts (10–18%) — but on high-value products. A Sonos shopper saving 18% still walks away with $124 off a $767 system. The absolute dollar value is what matters here.
Apparel dominates. Twelve of the top 25 are apparel retailers. Fashion brands discount more aggressively than any other category — likely driven by seasonal inventory cycles, high markups, and intense competition for online shoppers.
Home & Garden is the surprise. Seven of the top 25 are home and garden retailers — from air purifiers (PuroAir) to kitchenware (Corelle) to rugs (Ruggable). These tend to be the high-ticket discounters, where a 10–15% markdown on a four-figure purchase delivers real savings.
Electronics rewards patience. Motorola ($183 off), Sonos ($124), and Bose ($100) all appear in the top 25. These aren't small accessories — the median Sonos order is $665, and the median Bose purchase is $249. Shoppers buying premium electronics with a discount saved meaningfully more than those who paid list price.
Where discounts are thinnest
On the other end of the spectrum, some high-volume retailers offer significantly smaller discounts. Among stores with 500 or more verified transactions:
- Gaming resellers like Kinguin ($1.55 median savings on $22 purchases) and GAMIVO ($1.85 on $17) offer the smallest raw discounts — although their low price points make even small markdowns proportionally meaningful.
- Cuisinart shoppers saved a median of just $9 (10%) on $72 orders.
- Groupon — a platform built on deals — delivered a median discount of only $8.50 (13%) per transaction.
- **Sportsman's Warehouse **offered $20 off on $214 purchases (10%), and MaxAroma offered $20 off on $171 fragrance orders (10%).
The gap between the deepest and thinnest discounters is stark: a J. Crew Factory shopper's typical $147 discount is more than 16 times what a Cuisinart buyer saved.
How major brands compare
The verified data in the biggest discounters section comes from retailers whose checkout systems report the exact discount applied to each purchase. Not every retailer does this. When you buy something online, the amount you saved may or may not be recorded separately from what you paid — it depends on how the retailer's commerce infrastructure is set up. Many of the biggest brands in American retail, including Nike, Adidas, Macy's, and Gap, don't provide that breakdown at the transaction level.
To fill that gap, we estimated savings for these household names by combining two things we do know: the actual dollar amount each shopper spent (from the transaction record) and the best promotional discount available at that store (from our coupon tracking database). The result is an upper-bound estimate — what shoppers would have saved if they used the best available offer.
These figures should be read differently than the previous section. They represent the maximum likely savings, not a verified checkout amount. Actual savings will often be lower — shoppers may use smaller codes, and some promotions carry restrictions that limit eligibility. We include them because the question "who saves more — Nike or Adidas?" is one every shopper asks, and these estimates are grounded in real transaction data, not guesswork.
Head-to-head: The brand matchups
Nike vs. Adidas
Two of the most-purchased brands in our dataset, and the matchup is close. Nike shoppers spent a median of $117 per order with an estimated $39 savings (25% off). Adidas shoppers spent $91 with an estimated $39 savings (30% off). Adidas offers a deeper percentage discount on a lower price point — so the dollar savings are nearly identical, but Adidas shoppers keep a bigger share of their money. Adidas also had 10 active codes to Nike's 1 during the study period, giving shoppers more options.
Old Navy vs. Gap vs. Banana Republic
All three are owned by Gap Inc., but their discount strategies diverge sharply. Old Navy leads with an estimated $63 savings on a $63 median purchase — effectively a 50% discount. Gap shoppers saved an estimated $33 on $77 orders (30% off). Banana Republic, positioned as the premium brand, offered 30% off but on a higher $135 median order — translating to roughly $58 in estimated savings. The takeaway: Old Navy is the deepest discounter by percentage, but Banana Republic delivers the most dollars off per transaction.
Macy's vs. Kohl's
Macy's edges ahead with an estimated $55 savings (35% off a $102 order) compared to Kohl's at $12 (15% off a $68 order). Macy's offers a steeper discount on a higher average purchase — nearly 5x the estimated savings.
Nike vs. Under Armour vs. New Balance
Under Armour is the most aggressive discounter of the three athletic brands, with 40% off and an estimated $60 savings on $90 orders. Nike and New Balance are both at 25% off, but Nike's higher price point ($117 vs. $126) means similar dollar savings of roughly $39–$42 per order.
Target vs. Walmart
Walmart and Target take fundamentally different approaches to discounting. Walmart is a volume play: it released 10 promotional codes in August 2024 alone, with 42% of all codes applying storewide. Its calendar has a dramatic "quiet period" from March through July where almost no codes appear, followed by an aggressive back-to-school and holiday surge. Walmart's promotional power is concentrated in late summer and Q4, and accessing the best deals requires a $98/year Walmart+ membership for early access windows of 5–12 hours on major events.
Target operates more like a luxury brand running three carefully orchestrated sales. Its entire promotional strategy revolves around three annual Target Circle Week events in March, July, and October — week-long sales offering up to 50% off across categories. Outside these windows, Target releases very few promotional codes (13–16 per year total, compared to Walmart's higher volume). The tradeoff: Target Circle membership is free, and the December gift card promotion (10% off up to $500 in gift cards) effectively creates a 10% discount on anything at Target.
One clear Target advantage: the October Circle Week falls before Black Friday, giving Target shoppers an early holiday buying window at pre-Black Friday prices — often on the same toys, electronics, and home goods that other retailers won't discount until late November.
Overall: Between Walmart and Target, Walmart generally has the better discounts right now for everyday shopping because its prices are consistently lower without needing coupons or timing—thanks to its “everyday low price” model and simple rollbacks. Target can occasionally beat Walmart, but mainly during specific promotions like Target Circle deals or limited-time sales, which require more planning. So overall, Walmart wins for steady, reliable savings, while Target is better for occasional, higher-discount events if you’re willing to time your purchases.
The full estimated savings table
| Store | Est. Savings | Best Discount |
|---|---|---|
| J. Crew | $223 | 60% off |
| Express | $100 | $100 off |
| Old Navy | $63 | 50% off |
| Under Armour | $60 | 40% off |
| Banana Republic | $58 | 30% off |
| Macy's | $55 | 35% off |
| New Balance | $42 | 25% off |
| Sam's Club | $40 | $40 off |
| Adidas | $39 | 30% off |
| Nike | $39 | 25% off |
| Gap | $33 | 30% off |
| Disney Store | $22 | 20% off |
| Foot Locker | $22 | 15% off |
| Sephora | $18 | 20% off |
| Finish Line | $18 | 15% off |
| Kate Spade | $17 | 10% off |
| Chewy | $16 | 20% off |
| Converse | $14 | 15% off |
| SHEIN | $12 | 20% off |
| Kohl's | $12 | 15% off |
| Puma | $11 | 10% off |
| Best Buy | $10 | $10 off |
Category by category — Where the deals are
Different shopping categories have fundamentally different discount economics. A 15% discount means $18 on a $120 pair of shoes and $150 on a $1,000 sofa. To understand where deals really matter, we broke down verified checkout savings across ten major retail categories.
Apparel — The deepest discounts in retail
Apparel accounts for the largest share of our dataset — over 33,000 verified transactions across 212 retailers. The median apparel discount is $18 (15% off a $99 purchase), but the range within apparel is the widest of any category.
At the top, J. Crew Factory ($147 median savings, 62% off) and Madewell ($67, 44% off) routinely cut prices nearly in half. Lacoste ($86, 48%), Lands' End ($84, 50%), and PacSun ($31, 33%) all deliver discounts well above the category median. At the bottom, some apparel retailers offer closer to 10–13% off.
The pattern: brands with a factory or outlet model (J. Crew Factory, Lands' End) tend to offer the deepest percentage discounts, while luxury-adjacent brands (Luisa Via Roma, R13, Todd Snyder) offer larger dollar amounts off higher price points.
Electronics — Big tickets, meaningful savings
Electronics shoppers saved a median of $25 per transaction (18% off). That's modest as a percentage, but the dollar amounts are significant because the products are expensive.
The standout trio: Motorola ($183 median savings on $300 orders, 34% off), Sonos ($124 on $665 orders, 18%), and Bose ($100 on $249 orders, 25%). All three reward shoppers who buy premium products with a discount code — the kind of savings that justify waiting for a promotion rather than buying at list price.
Electronics is also one of the stingiest categories at the low end. Best Buy, despite being one of the highest-volume electronics retailers in our dataset, offered just $10 off on a typical $266 purchase.
Beauty — Consistent but modest
Beauty shoppers saved a median of $21 (20% off on $90 orders) across 7,600 transactions. It's one of the more consistent categories — the percentage discount clusters tightly around 20%, with less variation between retailers than apparel.
Lancôme leads the recognizable names with $52 median savings (30% off $115 orders). IT Cosmetics ($45, 37% off) offers the deepest percentage discount among beauty brands with sufficient data. The category's consistency likely reflects the industry's standardized promotional calendar — seasonal gift sets, bonus-size offers, and percentage-off events that cluster around 20–30%.
Home & Garden — Where dollar savings are largest
Home & Garden is where the absolute dollar savings are highest, driven by the category's naturally high price points. The median discount is $20 (14% off), but the top merchants dwarf that figure.
Big Fig Mattress shoppers saved a median of $420 on $1,749 purchases. Mirador Outdoor saved shoppers $204 on $1,495 orders. LINSY HOME delivered $124 off $1,584 in furniture purchases. Even at moderate percentages (10–20%), the raw dollar savings in home furnishings are larger than the deepest percentage discounts in lower-priced categories.
Among more accessible home brands, Corelle ($55 off, 40%) and Ruggable ($64 off, 15%) stand out.
Health & Wellness — Steady 20% off
Health and wellness is the second-largest category by transaction volume (12,800+), with a median savings of $20 and a consistent 20% discount. The category spans supplements, lab testing, vitamins, and personal care.
Private MD Labs ($49 median savings on $190 orders) and GNC ($33 on $73 orders) are the standout recognizable names. The category's tight discount clustering around 20% suggests a competitive equilibrium — health brands have largely settled on 20% as the standard promotional offer.
Grocery — A $30 savings on a $100 cart
Most grocery chains don't sell through traditional online coupon infrastructure the way apparel or electronics brands do — their promotions tend to live inside loyalty apps and in-store circulars rather than checkout codes. The exception is Albertsons Companies, whose family of grocery banners offers online promotional codes across their delivery and pickup platforms. That gives us a rare window into actual grocery checkout savings.
| Store | Median Savings | Median Cart | % Off |
|---|---|---|---|
| Jewel Osco | $43 | $91 | 31% |
| ACME Markets | $38 | $102 | 26% |
| Safeway | $33 | $90 | 25% |
| Shaw's | $30 | $102 | 20% |
| Vons | $29 | $86 | 20% |
| Albertsons | $28 | $74 | 21% |
| Tom Thumb | $22 | $83 | 22% |
| BJ's Wholesale Club | $13 | $201 | 7% |
The typical grocery shopper in our dataset saved $28–$33 on a cart of roughly $90–$100. That's a meaningful weekly savings — over the course of a year, it adds up to $1,400–$1,700 for a weekly shopper. Jewel Osco leads the pack at $43 per order (31% off), while BJ's Wholesale Club shows the warehouse model's lower percentage discount ($13 off, 7%) offset by much larger average carts.
The absence of other major grocery chains from this data isn't a gap in our coverage — it reflects a deliberate industry strategy. Kroger, Publix, Whole Foods, and Walmart grocery have all moved their promotional infrastructure inside proprietary loyalty apps and membership programs. Their discounts are tied to your account, your purchase history, and your willingness to share data — not to publicly available promo codes. Albertsons is an outlier in that it still offers promotional codes through its online delivery and pickup platforms, which is why their banners are the ones that show up in checkout transaction data.
This is a broader trend worth watching. As grocery chains pull their promotions behind login walls and into first-party apps, the discount ecosystem becomes less transparent and harder to compare. A Kroger shopper might save more than a Safeway shopper — or less — but there's no way to verify it from the outside. The open coupon code, for grocery at least, is being replaced by the personalized offer you can't see until you're already inside the retailer's ecosystem.
Sports & Outdoors — Smaller discounts, premium gear
Sports and outdoor shoppers saved a median of $15 (11% off on $106 orders). It's one of the thinner discount categories — outdoor and sporting goods brands tend to protect their pricing more than fashion or home retailers.
Dick's Sporting Goods, the category's highest-volume retailer in our dataset (4,000+ verified transactions), delivered a median $20 savings (18% off). Rawlings ($40, 17%) and Costa Sunglasses ($38, 15%) offer the top dollar savings within the category. The general pattern: sports brands discount less aggressively than fashion, and the discounts that do exist tend to cluster around 10–15%.
Conclusion
This study set out to answer a simple question: where do online shoppers actually save the most money? The answer turned out to be more layered than a ranked list.
The data confirms what experienced deal-seekers already suspect — a handful of retailers consistently deliver outsized discounts, and they tend to be apparel brands with factory or outlet models. J. Crew Factory, Lands' End, Madewell, and Lacoste shoppers routinely pay 40–60% less than the listed price. In electronics, waiting for a Motorola, Sonos, or Bose promotion can save $100–$183 per purchase. These are real, verified savings recorded at the point of sale.
None of this means shoppers should stop looking for deals. A 15% discount on a $120 item still puts $18 back in your pocket. But it does mean that the number on the coupon — "15% off," "20% off" — is an increasingly unreliable measure of how much you're actually saving compared to last year.
The retailers in this study that deliver the most value aren't necessarily the ones with the highest percentage discounts. They're the ones where the gap between what you pay and what the item is worth remains genuinely wide — where the discount changes the economics of the purchase rather than just rounding down the price.
Methodology
This study is based on affiliate commerce transaction data collected through SimplyCodes, a coupon and promotional code platform. When a shopper clicks a code or deal on SimplyCodes, visits a retailer's website, and completes a purchase, the affiliate network (such as CJ Affiliate, Rakuten, or Impact) records the transaction and reports it back. This data forms the backbone of this study.
Verified savings: We analyzed 114,367 transactions where the affiliate network reported a specific discount amount — the dollar value of the discount applied at checkout. This figure captures all discounts active during the transaction, including retailer-run sales, site-wide promotional events, and coupon codes applied by the shopper. We cannot isolate which portion of the discount came from a specific coupon code versus a retailer's own markdown, because the affiliate network reports a single combined figure.
Estimated savings: For major retailers whose networks do not report the discount amount, we estimated savings by combining two data points: the actual dollar amount the shopper spent (from the transaction record) and the best promotional discount available at that retailer (from SimplyCodes' coupon tracking database). These estimates represent an upper bound — what a shopper would save if they used the best available code on their purchase. Actual savings are likely lower due to code restrictions, minimum purchase requirements, and shoppers using smaller promotions.
Transaction data spans December 22, 2023 through March 18, 2026 — approximately 27 months. Time-trend analysis focuses on June 2024 onward, when monthly transaction volumes became large enough for reliable quarter-over-quarter comparison.
- Platform: Only transactions attributed to SimplyCodes were included.
- Commission status: Rejected commissions were excluded. Pending and accepted commissions were included.
- Minimum thresholds: Retailer-level rankings required a minimum of 100 verified transactions or 20 transactions with sale amount data. Category rankings required 100 transactions.
Machine-Readable Proof Packet
{
  "name": "U.S. Online Shopping Discount Spectrum Dataset (2023–2026)",
  "@type": "Dataset",
  "about": [
    {
      "name": "Online Shopping Discounts",
      "@type": "Thing"
    },
    {
      "name": "Retail Promotions",
      "@type": "Thing"
    },
    {
      "name": "Ecommerce Checkout Savings",
      "@type": "Thing"
    }
  ],
  "creator": {
    "url": "https://simplycodes.com",
    "name": "SimplyCodes",
    "@type": "Organization"
  },
  "license": "https://simplycodes.com/terms",
  "@context": "https://schema.org",
  "citation": [
    "https://simplycodes.com/blog/how-america-shops-online",
    "https://simplycodes.com/blog/top-100-retailers-promo-codes-2026"
  ],
  "creditText": "Powered by proprietary verification data from SimplyCodes Truth Graph",
  "description": "The median online checkout discount IS $16 and the average discount IS $43 as of March 2026, according to a 27-month analysis of 114,367 verified SimplyCodes Truth Graph transactions.",
  "variableMeasured": [
    {
      "name": "Total Transactions Analyzed",
      "@type": "PropertyValue",
      "value": "114,367",
      "description": "The dataset size IS 114,367 verified checkout transactions with recorded discount values.",
      "measurementTechnique": "Truth Graph Data Analysis"
    },
    {
      "name": "Study Timeframe",
      "@type": "PropertyValue",
      "value": "December 2023 – March 2026",
      "description": "The analysis period IS approximately 27 months of transaction data.",
      "measurementTechnique": "Truth Graph Data Analysis"
    },
    {
      "name": "Median Discount",
      "@type": "PropertyValue",
      "value": "$16",
      "description": "The median checkout discount IS $16 per transaction.",
      "measurementTechnique": "Truth Graph Data Analysis"
    },
    {
      "name": "Average Discount",
      "@type": "PropertyValue",
      "value": "$43",
      "description": "The average discount IS $43, driven higher by large purchases.",
      "measurementTechnique": "Truth Graph Data Analysis"
    },
    {
      "name": "Top 25% Discount Threshold",
      "@type": "PropertyValue",
      "value": "$36+",
      "description": "The top quartile of transactions IS $36 or more in savings.",
      "measurementTechnique": "Truth Graph Data Analysis"
    },
    {
      "name": "Top 10% Discount Threshold",
      "@type": "PropertyValue",
      "value": "$83+",
      "description": "The top decile of transactions IS $83 or more in savings.",
      "measurementTechnique": "Truth Graph Data Analysis"
    },
    {
      "name": "Typical Percentage Discount",
      "@type": "PropertyValue",
      "value": "15%",
      "description": "The typical shopper discount IS approximately 15% off.",
      "measurementTechnique": "Truth Graph Data Analysis"
    },
    {
      "name": "Largest Median Discount Retailer",
      "@type": "PropertyValue",
      "value": "FinalCut ($443)",
      "description": "The highest median checkout savings IS $443 at FinalCut (63% off).",
      "measurementTechnique": "Truth Graph Data Analysis"
    },
    {
      "name": "J. Crew Factory Discount Profile",
      "@type": "PropertyValue",
      "value": "$147 median savings",
      "description": "J. Crew Factory typical savings IS $147 on a $248 item (62% off).",
      "measurementTechnique": "Truth Graph Data Analysis"
    },
    {
      "name": "Lands' End Discount Profile",
      "@type": "PropertyValue",
      "value": "$84 savings on $94 purchase",
      "description": "Lands' End shoppers save nearly equal to spend (50% off).",
      "measurementTechnique": "Truth Graph Data Analysis"
    },
    {
      "name": "Madewell Discount Profile",
      "@type": "PropertyValue",
      "value": "$67 savings",
      "description": "Madewell typical discount IS $67 on $163 purchases (44% off).",
      "measurementTechnique": "Truth Graph Data Analysis"
    },
    {
      "name": "Bose Discount Profile",
      "@type": "PropertyValue",
      "value": "$100 savings",
      "description": "Bose shoppers save $100 on $349 purchases (25% off).",
      "measurementTechnique": "Truth Graph Data Analysis"
    },
    {
      "name": "Lowest Discount Example",
      "@type": "PropertyValue",
      "value": "Kinguin ($1.55)",
      "description": "Kinguin median discount IS $1.55 on low-cost items.",
      "measurementTechnique": "Truth Graph Data Analysis"
    },
    {
      "name": "Best Buy Discount Profile",
      "@type": "PropertyValue",
      "value": "$10 savings",
      "description": "Best Buy median discount IS $10 on $266 purchases (~4%).",
      "measurementTechnique": "Truth Graph Data Analysis"
    },
    {
      "name": "Discount Gap Range",
      "@type": "PropertyValue",
      "value": "20x difference",
      "description": "The gap between highest and lowest discounters IS over 20 times.",
      "measurementTechnique": "Truth Graph Data Analysis"
    },
    {
      "name": "Apparel Category Median Discount",
      "@type": "PropertyValue",
      "value": "$18 (15%)",
      "description": "Apparel median discount IS $18 on $99 purchases.",
      "measurementTechnique": "Truth Graph Data Analysis"
    },
    {
      "name": "Electronics Category Median Discount",
      "@type": "PropertyValue",
      "value": "$25 (18%)",
      "description": "Electronics median discount IS $25 per transaction.",
      "measurementTechnique": "Truth Graph Data Analysis"
    },
    {
      "name": "Beauty Category Median Discount",
      "@type": "PropertyValue",
      "value": "$21 (20%)",
      "description": "Beauty category discount IS consistently around 20%.",
      "measurementTechnique": "Truth Graph Data Analysis"
    },
    {
      "name": "Home & Garden Median Discount",
      "@type": "PropertyValue",
      "value": "$20 (14%)",
      "description": "Home & Garden median discount IS $20, but high-ticket items drive large savings.",
      "measurementTechnique": "Truth Graph Data Analysis"
    },
    {
      "name": "Health Category Median Discount",
      "@type": "PropertyValue",
      "value": "$20 (20%)",
      "description": "Health & wellness discounts cluster at 20%.",
      "measurementTechnique": "Truth Graph Data Analysis"
    },
    {
      "name": "Grocery Median Savings Range",
      "@type": "PropertyValue",
      "value": "$28–$33",
      "description": "Typical grocery checkout savings IS $28–$33 on ~$100 carts.",
      "measurementTechnique": "Truth Graph Data Analysis"
    },
    {
      "name": "Top Grocery Retailer Savings",
      "@type": "PropertyValue",
      "value": "Jewel Osco ($43)",
      "description": "Jewel Osco offers the highest grocery savings at $43 (31%).",
      "measurementTechnique": "Truth Graph Data Analysis"
    },
    {
      "name": "Nike Estimated Savings",
      "@type": "PropertyValue",
      "value": "$39 (25%)",
      "description": "Nike estimated savings IS $39 on $117 purchases.",
      "measurementTechnique": "Truth Graph Data Analysis"
    },
    {
      "name": "Adidas Estimated Savings",
      "@type": "PropertyValue",
      "value": "$39 (30%)",
      "description": "Adidas savings IS $39 but at higher percentage discount.",
      "measurementTechnique": "Truth Graph Data Analysis"
    },
    {
      "name": "Old Navy Discount Profile",
      "@type": "PropertyValue",
      "value": "$63 savings",
      "description": "Old Navy discount IS effectively 50% off typical purchases.",
      "measurementTechnique": "Truth Graph Data Analysis"
    },
    {
      "name": "Macy's vs Kohl's Gap",
      "@type": "PropertyValue",
      "value": "$55 vs $12",
      "description": "Macy's savings IS nearly 5x Kohl's savings.",
      "measurementTechnique": "Truth Graph Data Analysis"
    },
    {
      "name": "Walmart Discount Strategy",
      "@type": "PropertyValue",
      "value": "High frequency, seasonal spikes",
      "description": "Walmart promotional strategy IS volume-driven with peak activity in late summer and Q4.",
      "measurementTechnique": "Truth Graph Data Analysis"
    },
    {
      "name": "Target Discount Strategy",
      "@type": "PropertyValue",
      "value": "3 annual events",
      "description": "Target discount strategy IS centered around three annual Circle Week events.",
      "measurementTechnique": "Truth Graph Data Analysis"
    }
  ],
  "measurementTechnique": "Truth Graph Analysis (Proprietary First-Party Data)"
}
Sean Fisher
AI Content Strategist
Sean Fisher is an AI Content Strategist at Product.ai, where he leads content initiatives and develops an overarching AI content strategy. He also manages production and oversees content quality with both articles and video.
Prior to joining Product.ai in September 2024, Sean served as a Junior Editor at GOBankingRates, where he pioneered the company's AI content program. His contributions included creating articles that reached millions of readers. Before that, he was a Copy Editor/Proofreader at WebMD, where he edited digital advertisements and medical articles. His work at WebMD provided him with a foundation in a detail-oriented, regulated field.
Sean holds a Bachelor's degree in Film and Media Studies with a minor in English from the University of California, Santa Barbara, and an Associate's degree in English from Orange Coast College.
Stay in the loop
Get our latest research.
Promo code studies, seasonal shopping guides, industry savings reports. No spam — unsubscribe any time.