In April 2026, SimplyCodes conducted a survey of 1,463 U.S. online shoppers about how they find, use, and experience promo codes at checkout. The goal was straightforward: build a comprehensive, data-backed picture of the American coupon experience — what's working, what's failing, and what shoppers actually want from the savings tools they rely on.
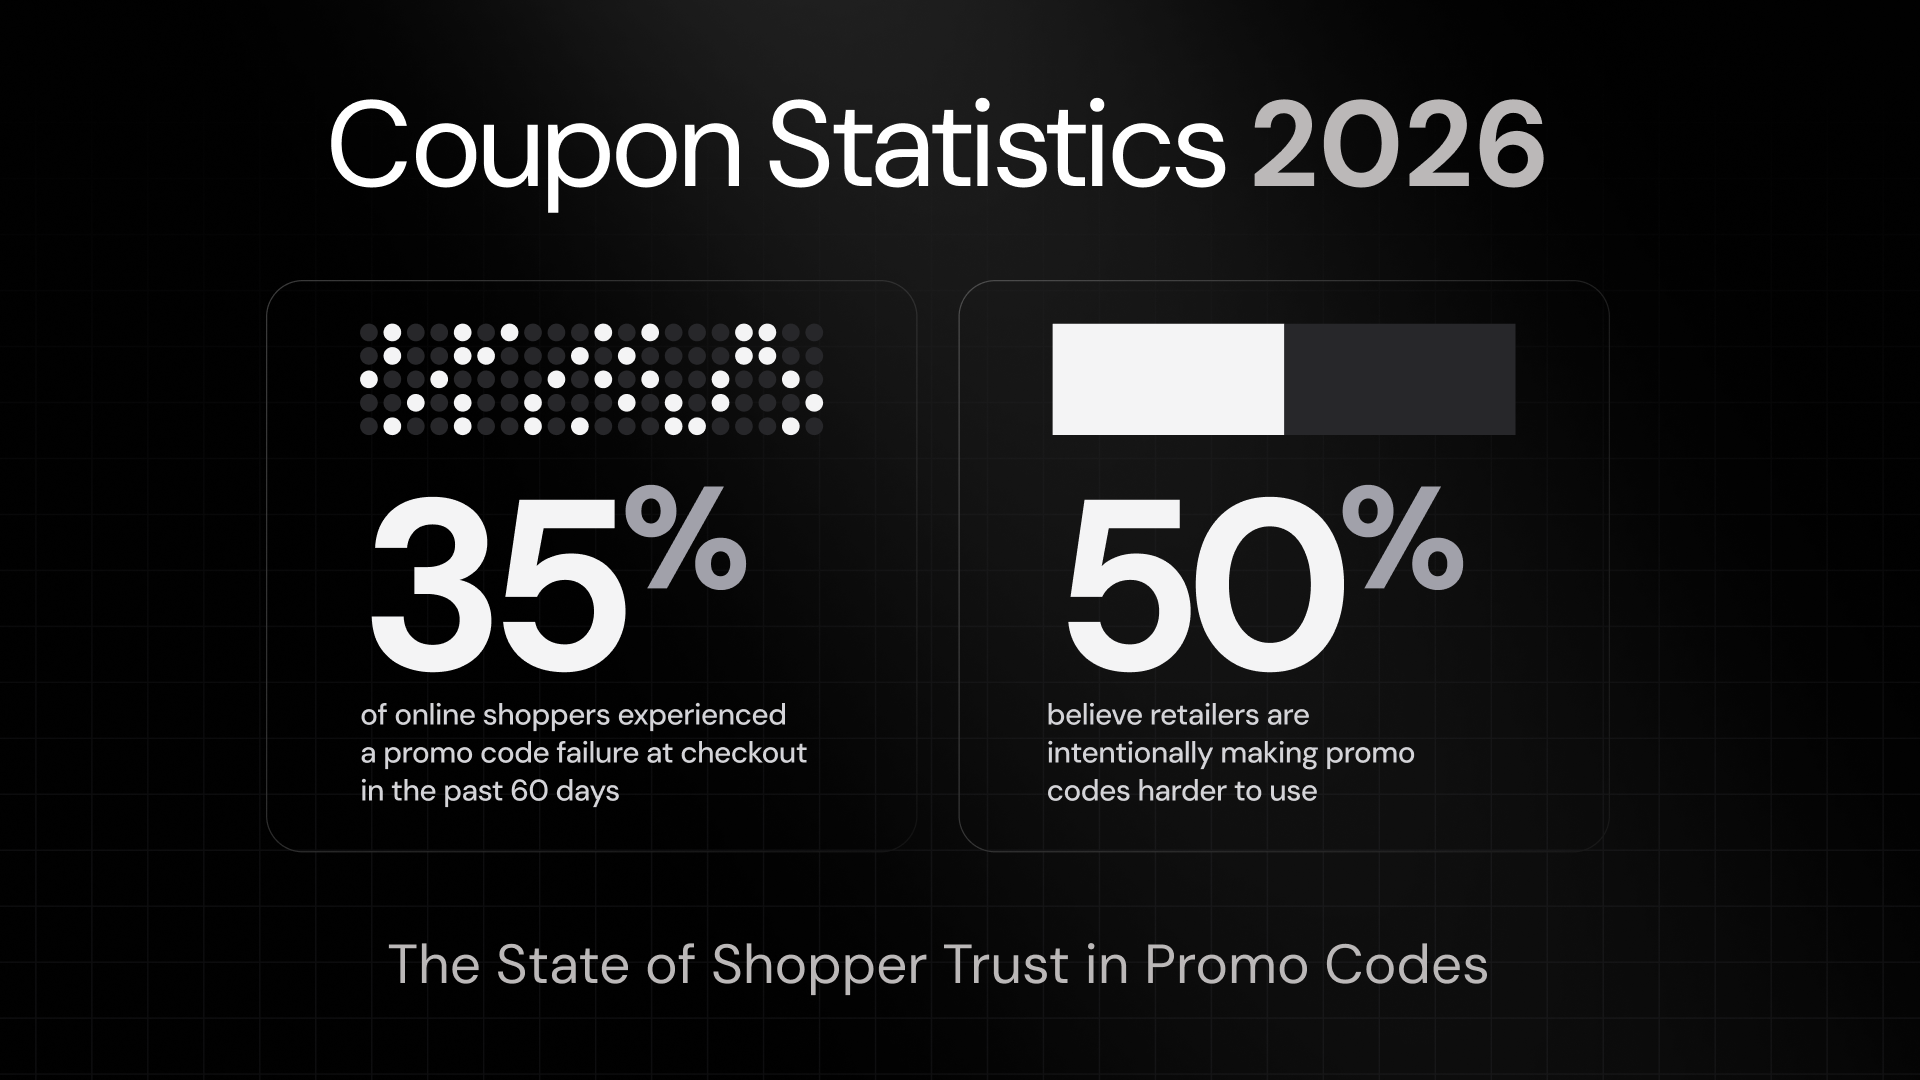
The results point to a systemic problem we're calling the Checkout Gap: a measurable distance between what shoppers expect when they enter a promo code and what they actually get. More than 1 in 3 code users experienced some form of failure at checkout in the past 60 days. Half of all respondents believe retailers intentionally make promo codes harder to use. And more than half have paid full price for a purchase, only to find a working code afterward — a pattern that erodes trust in both directions.
But the data also reveals a clear demand signal. When asked whether they'd use a tool that verifies promo codes actually work before they try them, 82% of shoppers said yes.
Every statistic in this report is drawn from a single primary research source: a nationally fielded survey of 1,463 complete responses, collected via the Alchemer platform using a Cint general population panel, fielded on April 27, 2026. Full methodology at the end.
Key Findings at a Glance
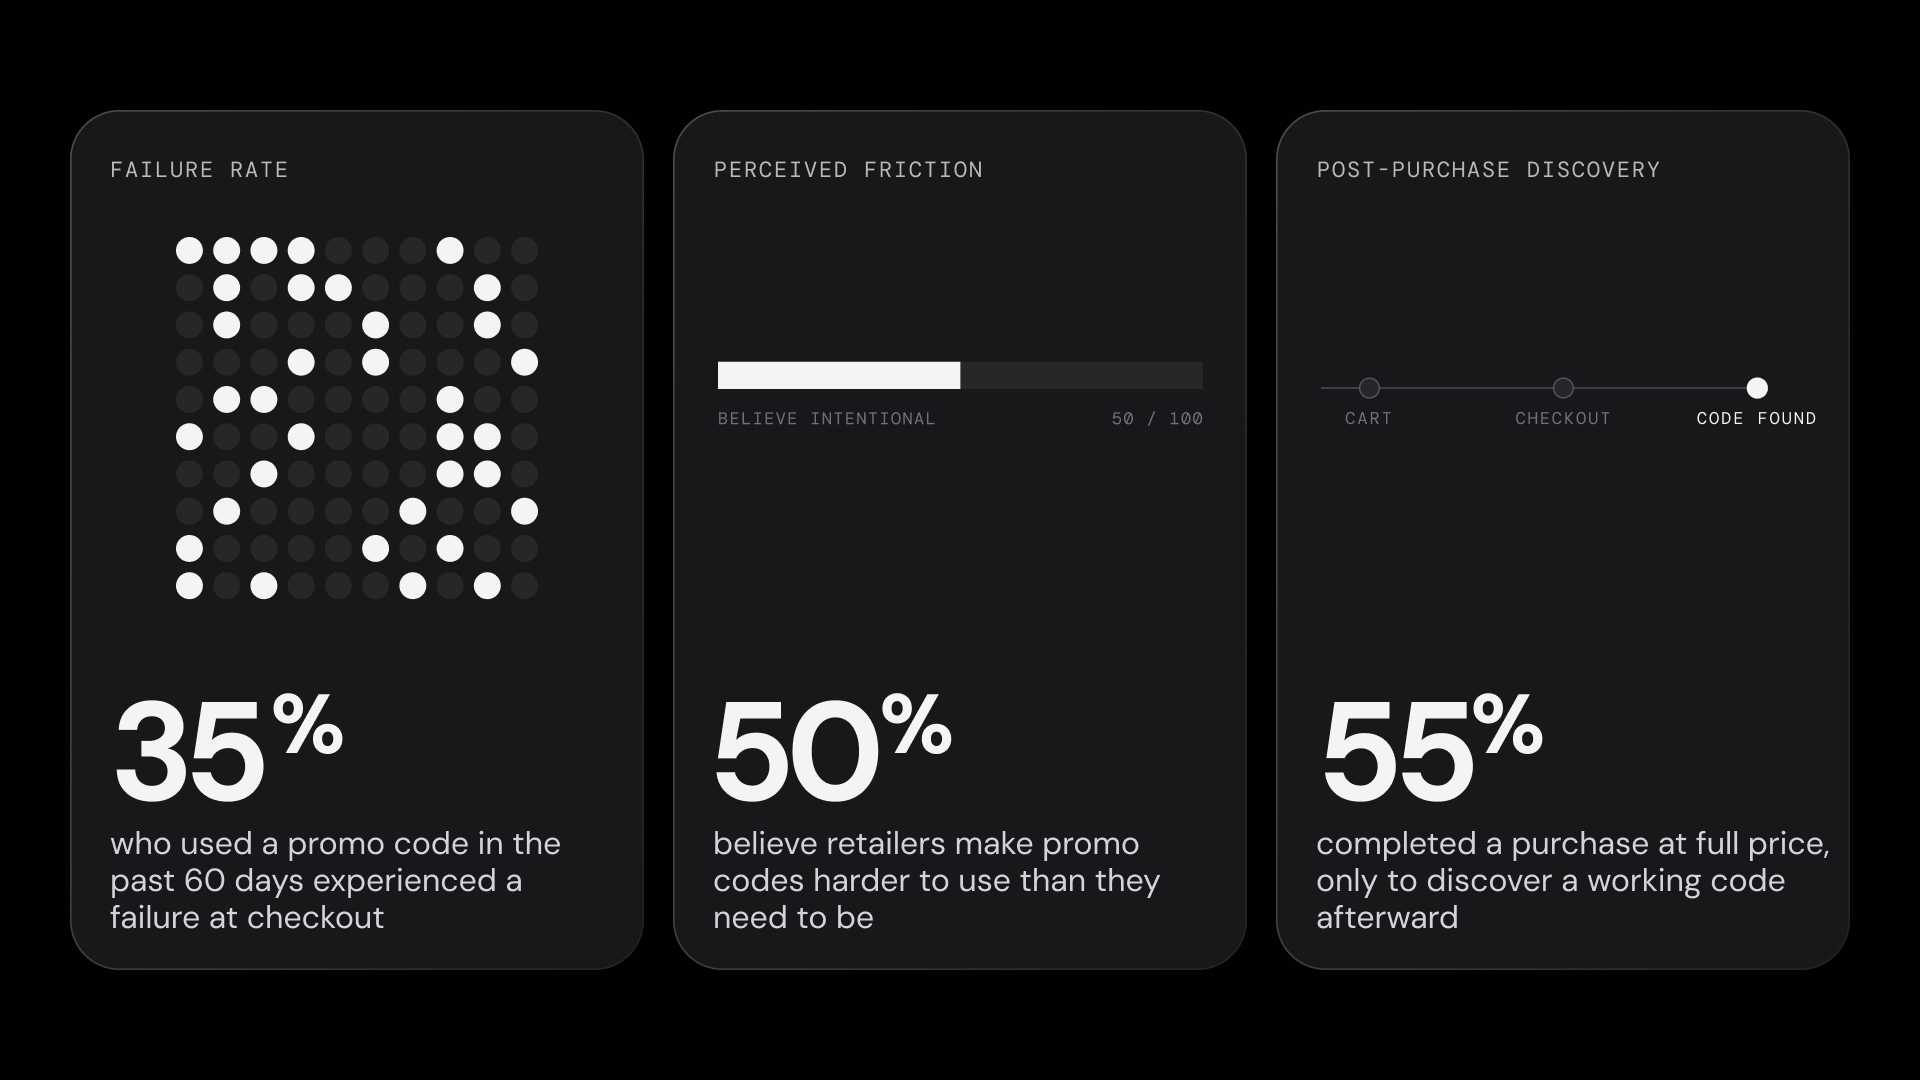
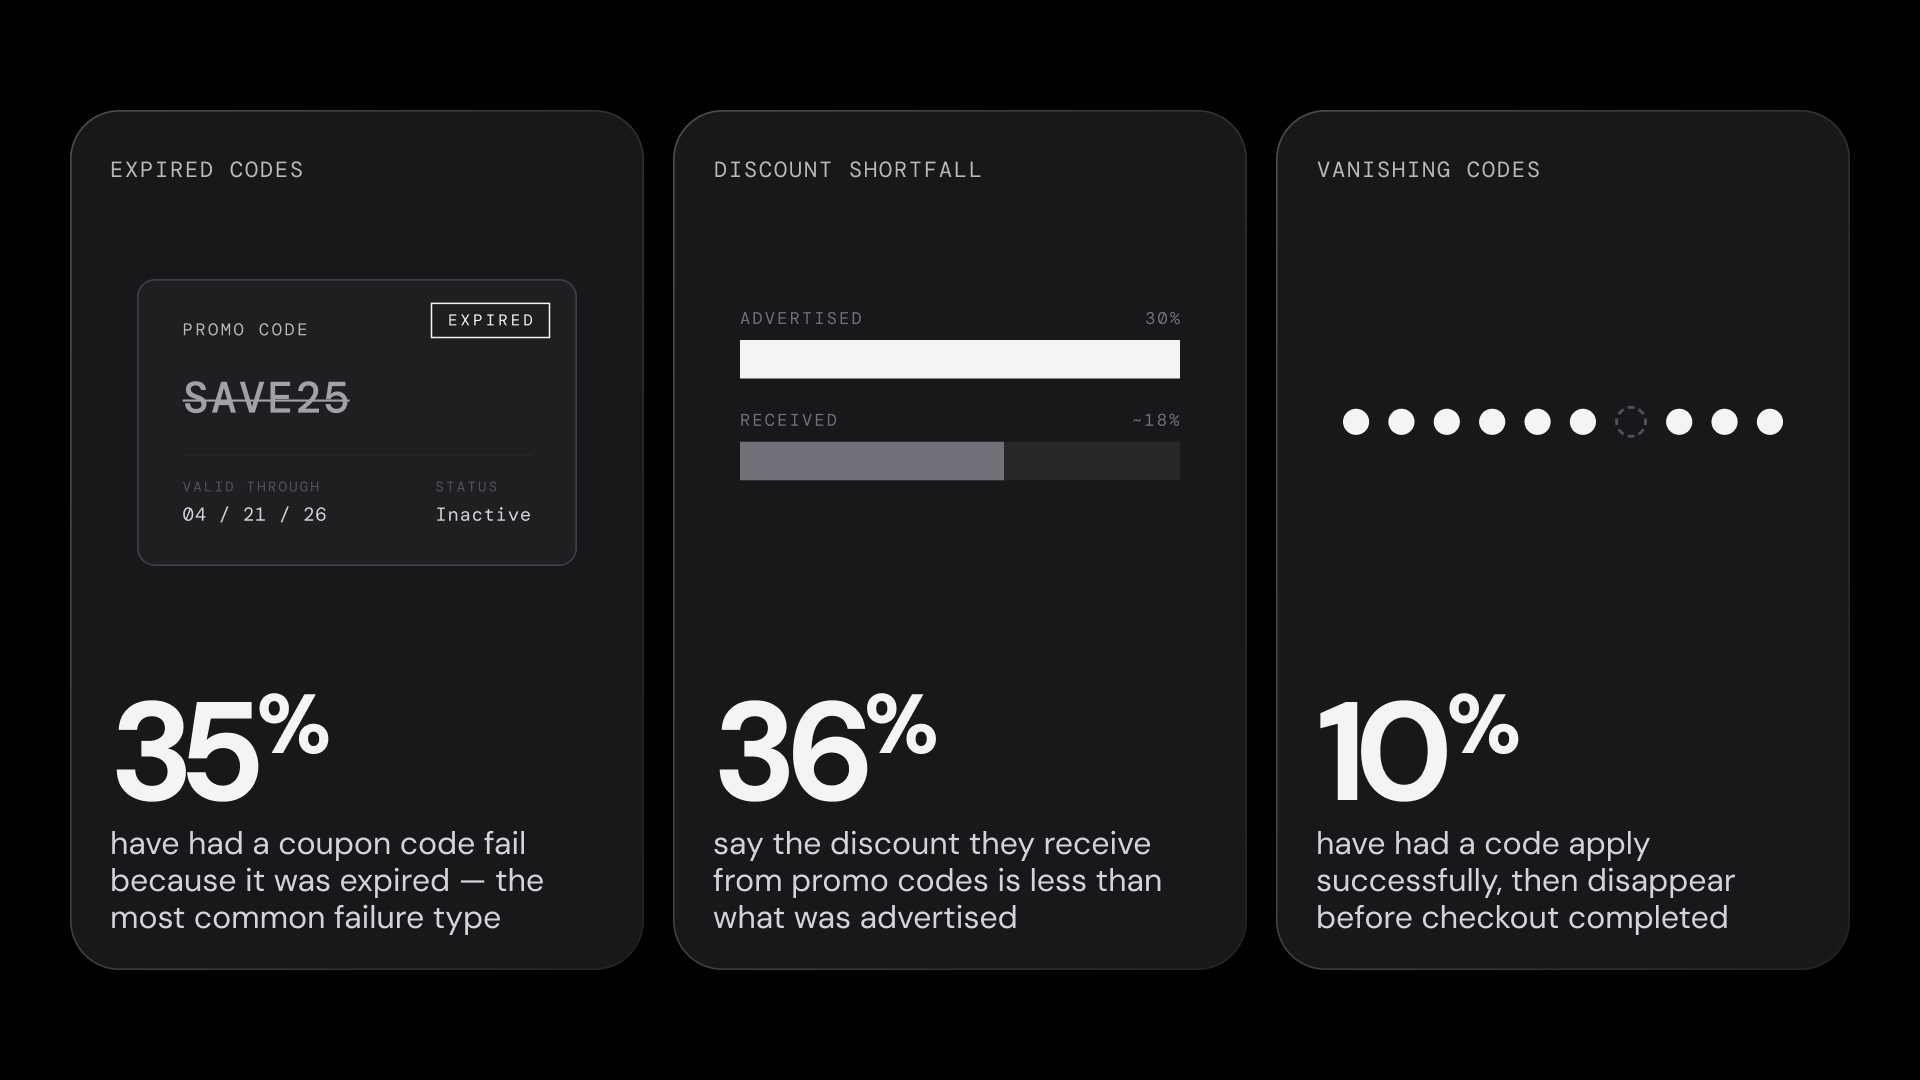
- 35% of U.S. online shoppers who used a promo code in the past 60 days experienced failure — the code either didn't work at all or delivered a smaller discount than expected.
- 50% of shoppers believe retailers are intentionally making promo codes harder to use than they need to be.
- 55% have completed a purchase at full price, only to discover a working promo code afterward.
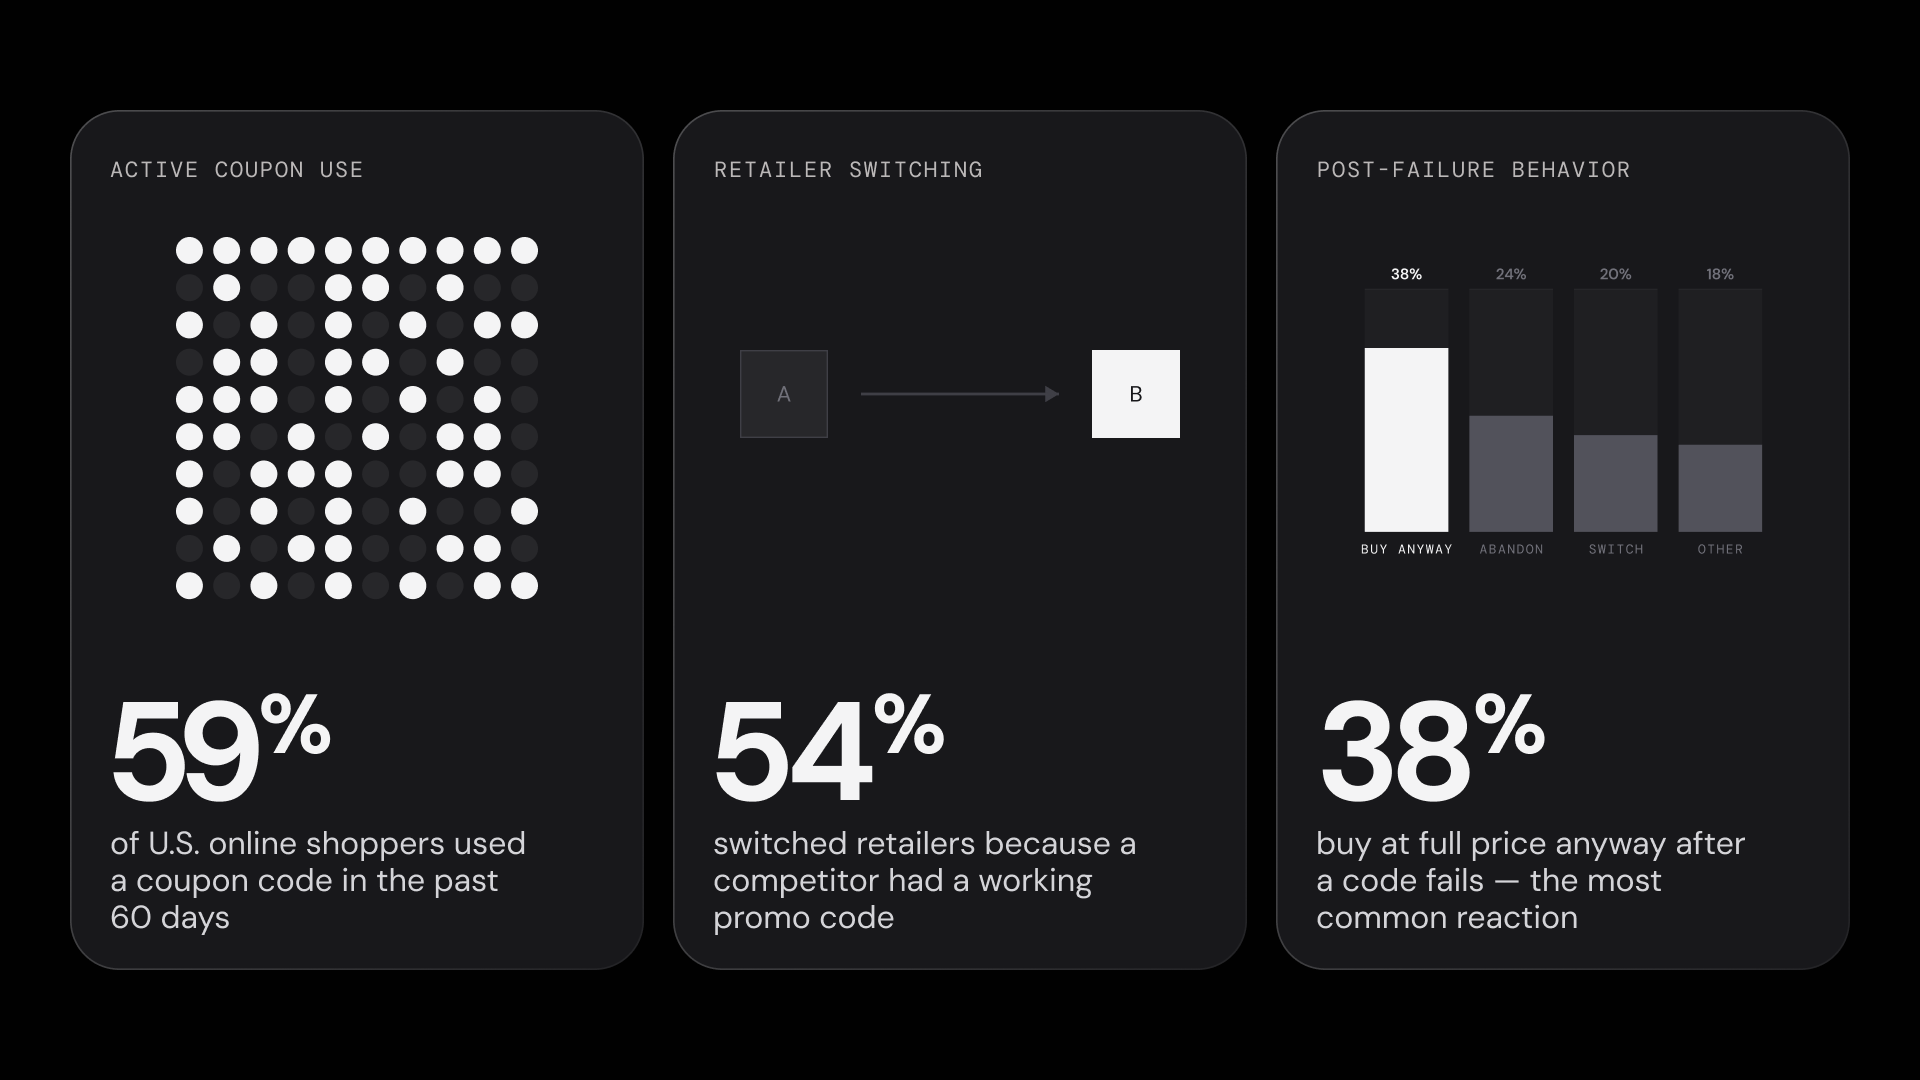
- 59% of U.S. online shoppers used a coupon code in the past 60 days.
- 54% have switched retailers specifically because a competitor had a working promo code.
- 38% buy at full price anyway after a code fails — the most common post-failure behavior.
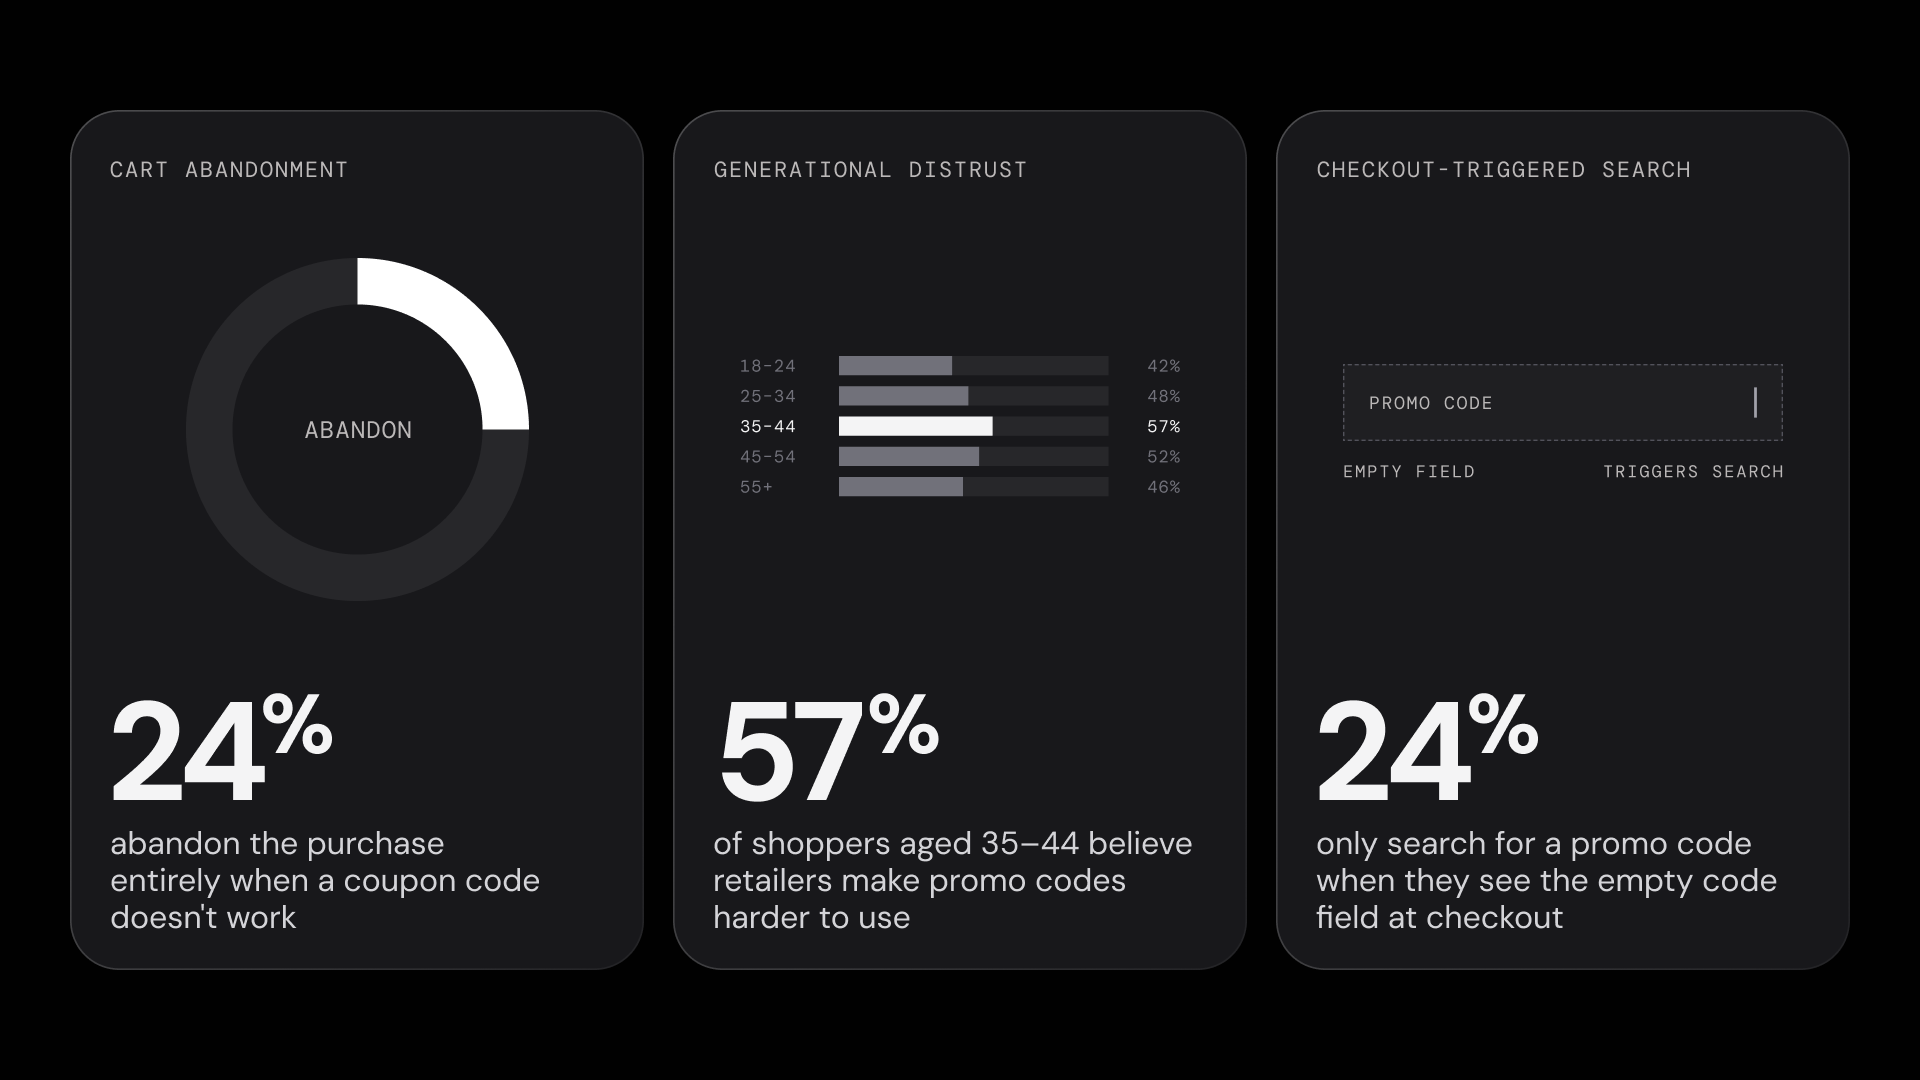
- 24% abandon the purchase entirely when a coupon code doesn't work.
- 57% aged 35–44 believe retailers make promo codes harder to use
- 24% of shoppers only search for a promo code when they see the empty code field at checkout.
- 35% have had a coupon code fail because it was expired — the most common failure type.
- 36% say the discount they receive from promo codes is sometimes or often less than what was advertised.
- 10% of shoppers have had a code apply successfully, then disappear before checkout completed.
How U.S. Online Shoppers Search for Promo Codes
Key Findings in This Section:
- 24% of shoppers only search for a code when they see the promo code box at checkout
- 24% always search for codes before buying
- 48% of U.S. online shoppers actively search for promo codes, either habitually or at checkout
- Only 11% use a browser extension that automatically applies codes
Before measuring what goes wrong with promo codes, it helps to understand how shoppers look for them in the first place. The survey asked respondents to identify the single behavior that best describes their typical approach to finding codes and discounts when shopping online.
The results split into five roughly even behavioral groups, with no single approach commanding a majority:
| Behavior | % of Respondents |
|---|---|
| I always search for codes before buying | 24% |
| I search when I see a promo code box at checkout | 24% |
| I only use codes if they come to me (email, text, notifications) | 22% |
| I rarely or never look for promo codes | 19% |
| I use a browser extension that automatically applies codes | 11% |
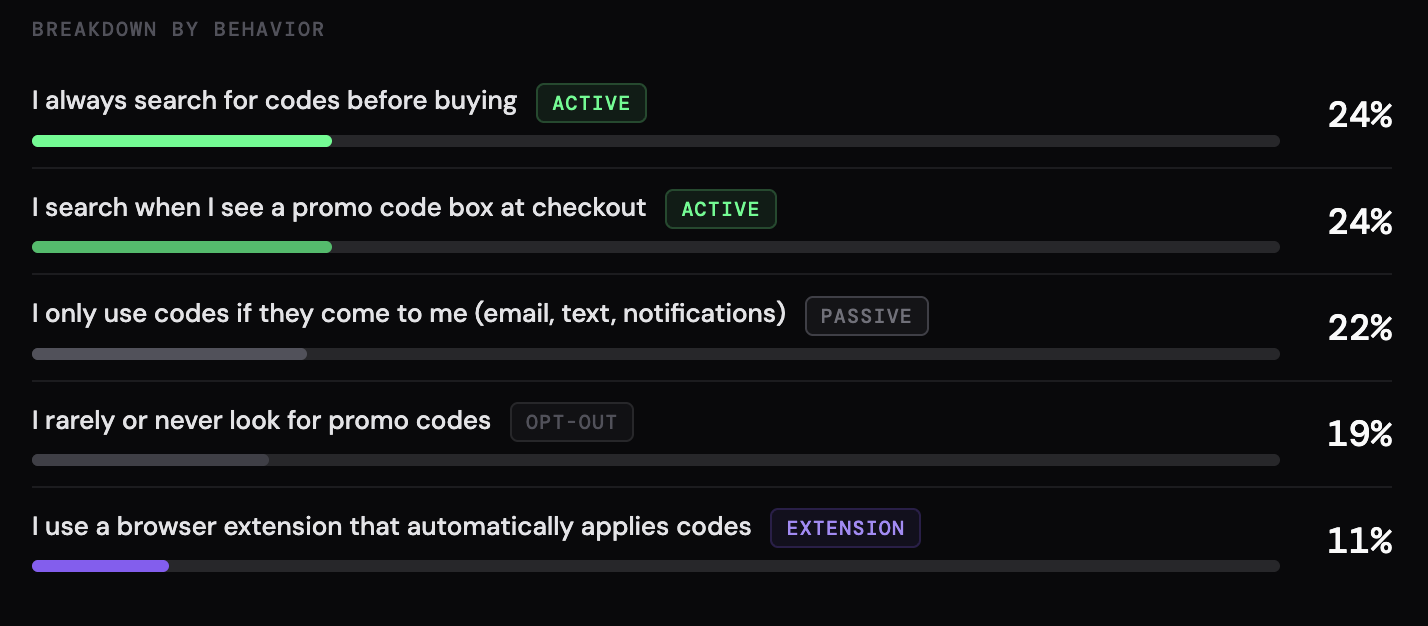
The two largest groups — habitual searchers and checkout-triggered searchers — are tied at 24% each, but they represent meaningfully different behaviors. Habitual searchers build code-hunting into their purchase routine before they reach the cart. Checkout-triggered searchers only begin looking when they encounter an empty promo code field during the payment process. The promo code box itself is the prompt: 1 in 4 U.S. online shoppers wouldn't search for a code at all if the field weren't there.
Behind them, 22% of shoppers take a passive approach: they'll use a code if one arrives in their inbox or notifications, but they don't go looking. Another 19% rarely or never engage with promo codes at all.
Browser extensions, which automatically scan and apply codes at checkout, account for 11% of shoppers. This is the smallest behavioral segment — a notable finding given the category's visibility in recent years.
Taken together, the data shows that nearly half of U.S. online shoppers (48%) actively search for promo codes, either as a habit or in response to the checkout field. Another 22% will use codes opportunistically. Only about 1 in 5 opt out of using coupon codes entirely.
Where Shoppers Go for Promo Codes — and Who They Trust
Key Findings in This Section:
- Coupon websites are the most trusted source for promo codes, ranking #1 of 7 sources
- Browser extensions rank 5th of 7 in source trust — below brand newsletters, above Reddit
- Brand loyalty programs lead savings tool trust at net +32%
- Social media deal accounts are the only savings tool category at or below net zero (−1%)
Knowing that nearly half of U.S. online shoppers actively search for codes raises a follow-up question: where do they go, and which sources do they trust to deliver working codes?
Promo Code Source Trust
Respondents ranked seven common promo code sources from most to least trusted. The results are reported as mean rank, where a lower number indicates higher trust.
| Source | Mean Rank (1 = Most Trusted) |
|---|---|
| Coupon websites (RetailMeNot, Coupons.com) | 3.34 |
| Google search | 3.46 |
| Friends or family | 3.53 |
| Brand newsletters or emails | 3.75 |
| Browser extensions (Honey, Capital One Shopping) | 4.05 |
| Reddit or online forums | 4.91 |
| TikTok or social media | 4.97 |
Coupon aggregator websites hold the top position, followed closely by Google search and personal recommendations from friends and family. Brand-direct communications (newsletters, promotional emails) rank fourth — trusted, but not as much as third-party aggregators or personal networks.
Browser extensions rank fifth of seven sources. The gap between brand newsletters (3.75) and browser extensions (4.05) is the largest single-step drop in the ranking, placing extensions closer to community platforms than to established coupon channels.
Reddit and TikTok/social media sit at the bottom. Despite growing visibility as deal-sharing platforms, community and social channels have not yet displaced traditional coupon sources in consumer trust.
Savings Tool Trust
A separate question measured trust in five categories of savings tools on a 1–10 scale. The net trust score below represents the difference between the top-two-box (high trust) and bottom-two-box (low trust) shares.
| Savings Tool | Net Trust (Top 2 Box – Bottom 2 Box) |
|---|---|
| Brand loyalty programs | +32% |
| Coupon websites | +21% |
| Cash-back apps | +17% |
| Browser extensions | +10% |
| Social media deal accounts | −1% |
Brand loyalty programs lead by a wide margin, the only savings tool category that carries a direct, first-party relationship between the shopper and the retailer. Coupon websites and cash-back apps hold solidly positive positions. Browser extensions sit in net-positive territory but at a fraction of the trust levels enjoyed by loyalty programs and coupon sites. Social media deal accounts are the only category at or below zero — as many shoppers actively distrust them as trust them.
The two rankings tell a consistent story. Whether measured by source trust or tool trust, the hierarchy follows a pattern: first-party and established aggregator channels lead, browser extensions occupy a middle-to-low tier, and social and community platforms trail.
Promo Code Failure Rates — the Checkout Gap
Key Findings in This Section:
- 59% of U.S. online shoppers used a promo code in the past 60 days
- 35% of code users experienced some form of failure — either the code didn't work at all (18%) or delivered a smaller discount than expected (16%)
- Expired codes are the most common failure type at 35%, followed by hidden restrictions (28%) and new-customer-only codes (23%)
- 10% of shoppers experienced a code that applied successfully, then disappeared before checkout completed
Of the 1,463 respondents in the study, 59% had tried using a promo code online in the past 60 days. Those code users were asked a direct question: did the code work, and did you receive the discount you expected?
| Code Outcome | % of Code Users |
|---|---|
| Code worked and delivered the expected discount | 66% |
| Code worked but the discount was smaller than expected | 16% |
| Code did not work — no discount received | 18% |
One in three code users (34%) experienced some form of failure. Rounded, that figure is 35% — what we call the Checkout Verification Index, the consistent baseline used for all segment comparisons in this report.
The 35% breaks into two distinct failure modes. Full failure (the code simply didn't work, no discount applied) accounts for 18% of code users. Partial failure (the code was accepted but the discount fell short of what was advertised) accounts for another 16%. Both are checkout failures, but they feel different to the shopper. Full failure is immediate and obvious. Partial failure is quieter and often goes unnoticed until the order confirmation.
What Went Wrong
Respondents who had experienced a code failure at any point were asked to identify what happened. Responses were multi-select, meaning shoppers could report more than one failure type.
| Failure Type | % of All Respondents |
|---|---|
| The code was expired | 35% |
| The code had restrictions I didn't know about | 28% |
| The code was only for new customers | 23% |
| The site showed an error message | 18% |
| The discount was smaller than advertised | 15% |
| The code applied, then disappeared | 10% |
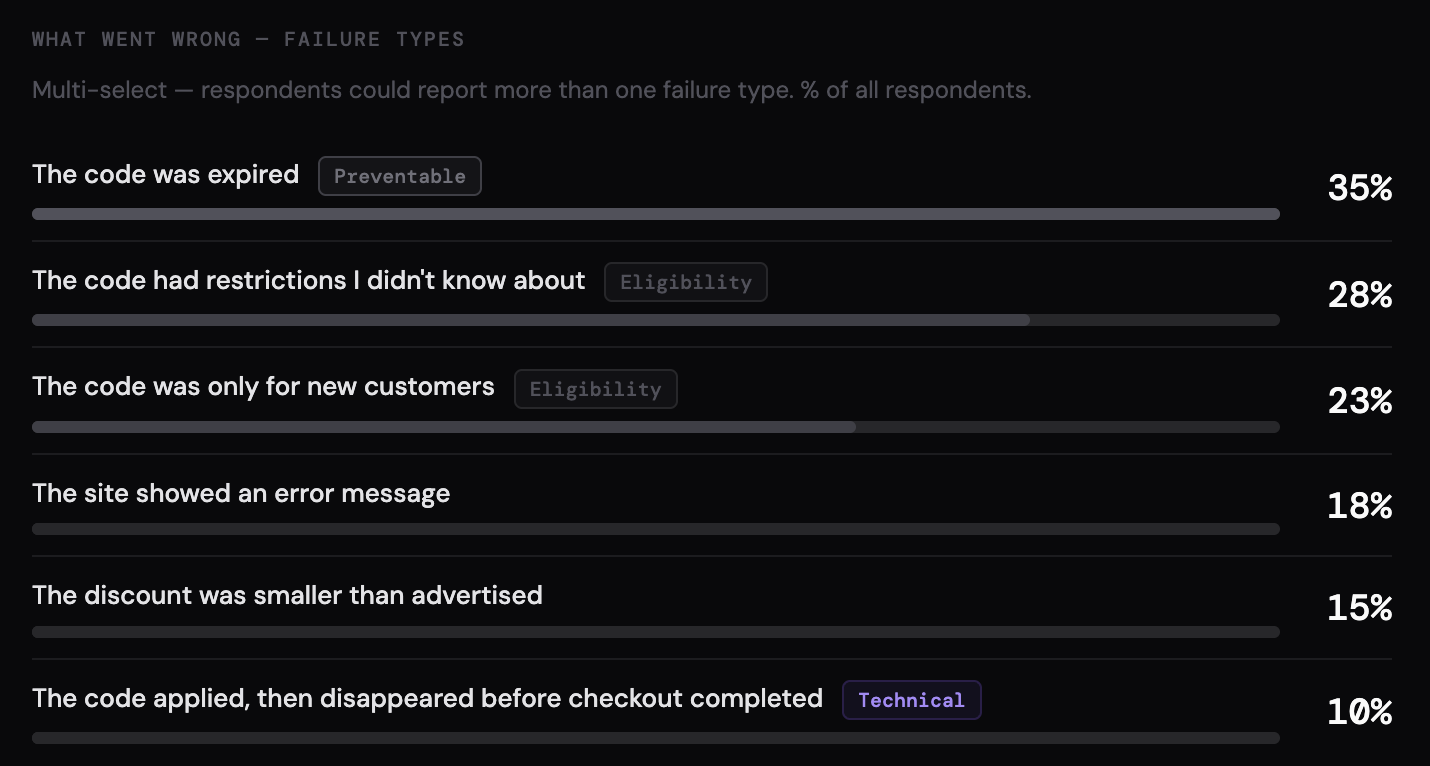
Expired codes top the list at 35% — a failure mode that is, in principle, preventable through real-time code verification. Hidden restrictions (28%) and new-customer-only limitations (23%) represent a different category of failure: the code technically works, but eligibility rules the shopper didn't know about prevent it from applying.
The bottom of the list surfaces a less common but more disorienting experience. One in ten shoppers reports a code that appeared to apply successfully and then vanished before the transaction completed (likely a session-expiry or single-use logic issue that produces a uniquely frustrating checkout moment).
Coupon Behavior by Age and Gender
Key Findings in This Section:
- 35–44 year-olds are the most active code users: 70% tried a promo code in the past 60 days
- Shoppers aged 25–34 experience the highest failure rate of any age group at 37% — nearly double the rate of those 65 and older (19%)
- 18–24 year-olds hit "hidden restrictions" at 40%, the highest of any age cohort
- Men are 11 points more likely than women to have paid full price and then found a working code afterward (61% vs. 50%)
- 25–34 men experience a 45% code failure rate and a 71% Reverse Checkout Gap rate — the sharpest intersection in the dataset
The previous sections report topline findings across all 1,463 respondents. This section breaks down the same coupon metrics by age, gender, and their intersections. The demographic cuts reveal variance that the overall averages obscure — particularly by age, where the spread between the youngest and oldest cohorts is substantial across nearly every measure.
By Age
Code usage. Respondents were asked whether they had tried using a promo code in the past 60 days. Usage peaks in the middle age bands and drops sharply after 55.
| Age Group | % Used a Code in Past 60 Days |
|---|---|
| 35–44 | 70% |
| 18–24 | 68% |
| 45–54 | 65% |
| 25–34 | 63% |
| 55–64 | 53% |
| 65+ | 48% |
The steepest single drop is between 45–54 (65%) and 55–64 (53%), a 12-point decline. By age 65 and older, fewer than half of respondents had used a promo code in the preceding two months.
Failure rates. Among those who used a code, the share who experienced any form of failure (full failure or smaller-than-expected discount) varies considerably by age.
| Age Group | Failure Rate (Among Code Users) |
|---|---|
| 25–34 | 37% |
| 18–24 | 35% |
| 35–44 | 33% |
| 45–54 | 32% |
| 55–64 | 29% |
| 65+ | 19% |
Shoppers aged 25–34 experience the highest failure rate at 37%. The rate declines with each successive age band, reaching 19% for those 65 and older, roughly half the rate of the youngest cohorts.
Failure types. The nature of code failure also differs by age. The three most common failure types are broken out below.
| Failure Type | 18–24 | 25–34 | 35–44 | 45–54 | 55–64 | 65+ |
|---|---|---|---|---|---|---|
| Expired codes | 30% | 34% | 36% | 43% | 32% | 34% |
| Hidden restrictions | 40% | 32% | 29% | 25% | 24% | 24% |
| New customers only | 28% | 28% | 29% | 20% | 21% | 15% |
Hidden restrictions are the top failure type for the 18–24 group at 40%, nearly double the rate reported by those 65 and older (24%). The "new customers only" pattern follows a similar age gradient: 28–29% for shoppers under 44, dropping to 15% for those 65+. Expired codes, by contrast, are relatively consistent across all age groups.
Post-failure behavior. When a code fails, what shoppers do next also varies by age.
| Behavior | 18–24 | 25–34 | 35–44 | 45–54 | 55–64 | 65+ |
|---|---|---|---|---|---|---|
| Bought at full price | 49% | 43% | 41% | 38% | 32% | 29% |
| Abandoned the purchase | 30% | 23% | 23% | 25% | 24% | 23% |
| Left for a competitor | 28% | 21% | 23% | 21% | 12% | 17% |
| Came back later | 21% | 16% | 19% | 13% | 11% | 9% |
The 18–24 group reports the highest rates across every post-failure behavior measured — buying at full price (49%), abandoning (30%), switching to a competitor (28%), and returning later (21%). The pattern narrows with age: shoppers 65 and older report lower rates on every measure, with buying at full price at 29% and returning later at 9%.
Deliberate-intent belief. Respondents were asked whether they believe some retailers intentionally make promo codes harder to use.
| Age Group | Yes | No | Never Thought About It |
|---|---|---|---|
| 35–44 | 57% | 23% | 21% |
| 18–24 | 53% | 26% | 22% |
| 45–54 | 52% | 21% | 27% |
| 25–34 | 51% | 33% | 15% |
| 55–64 | 49% | 19% | 32% |
| 65+ | 42% | 15% | 44% |
The 35–44 cohort holds the strongest conviction at 57%. The belief exceeds 50% for every age group under 55. Among those 65 and older, the "yes" rate drops to 42% — but that decline is driven primarily by the 44% who have never considered the question, not by active disagreement (only 15% say "no").
Verification tool appetite. The share of respondents who say they would "definitely" use a code verification tool peaks at 35–44 (46%) and is lowest among those 65+ (29%). However, the combined top-two-box measure (definitely + probably) remains high across all ages: 85–87% for shoppers 18–54, 80% for those 55–64, and 76% for those 65+.
Retailer switching and the Reverse Checkout Gap.
| Age Group | Switched Retailer for Working Code | Paid Full Price, Then Found Code |
|---|---|---|
| 18–24 | 64% | 62% |
| 25–34 | 58% | 66% |
| 35–44 | 62% | 64% |
| 45–54 | 61% | 58% |
| 55–64 | 49% | 50% |
| 65+ | 41% | 39% |
Both measures show a clear age gradient. Shoppers aged 25–34 report the highest Reverse Checkout Gap rate (66%). Retailer switching peaks at 18–24 (64%). Both drop substantially for shoppers 55 and older.
Code reliability perception. Asked whether promo codes feel more or less reliable compared with one to two years ago, the youngest cohorts are the most likely to say "more reliable" (31% of 25–34 year-olds), while 65+ respondents overwhelmingly report no perceived change (67% say "about the same"). The "less reliable" response is relatively consistent across ages at 10–16%.
By Gender
Gender differences in coupon behavior are smaller than age differences but follow a consistent directional pattern across most measures.
Code usage. Men are slightly more likely to have tried a code in the past 60 days (62% vs. 58%). Code-seeking style — the split between habitual searchers, checkout-triggered searchers, passive recipients, and non-users — is nearly identical across genders.
Failure rates. Among code users, men experience a slightly higher overall failure rate: 32% vs. 29% for women. The composition of that failure differs: men are more likely to receive a smaller-than-expected discount (19% vs. 12%), while women are slightly more likely to experience total code failure (15% vs. 11%).
Post-failure behavior. The largest behavioral gender gap appears in the "bought at full price anyway" response: 41% of men vs. 34% of women, a 7-point difference. Abandonment rates are nearly identical (women 25%, men 24%).
Deliberate-intent belief. Men are more likely to believe retailers intentionally make codes harder to use: 53% vs. 47%, a 6-point gap. Women are more likely to have never considered the question (32% vs. 23%). Brand trust erosion after code failure is nearly identical across genders, with approximately 26% reporting reduced trust in the retailer.
The Reverse Checkout Gap. This is where the largest gender difference in the dataset appears. 61% of men have paid full price and then found a working code afterward, compared with 50% of women — an 11-point gap. Men are also slightly more likely to have switched retailers for a working code (56% vs. 53%).
Code reliability perception. Men are more likely to say codes feel "more reliable" than one to two years ago (26% vs. 15%, an 11-point gap). Women are slightly more likely to say "less reliable" (15% vs. 12%). Both genders report "about the same" at similar rates (women 60%, men 55%).
By Age × Gender
When age and gender are crossed, several cohort-level findings emerge with sharper variance than either dimension produces alone.
| Cohort | Stat | Overall Benchmark | Comparison |
|---|---|---|---|
| Men 25–34 | 71% experienced the Reverse Checkout Gap | 55% overall | vs. 39% of women 65+ (32-point spread) |
| Men 25–34 | 45% code failure rate | 35% overall | vs. 16% of men 65+ (29-point spread) |
| Men 35–44 | 59% believe retailers deliberately break codes | 50% overall | vs. 39% of women 65+ (20-point spread) |
| Men 25–34 | 61% switched retailer for a working code | 54% overall | vs. 42% of women 65+ (19-point spread) |
Men aged 25–34 appear at the high end of three of the four intersection cuts — failure rate, Reverse Checkout Gap, and retailer switching. Men aged 35–44 hold the highest deliberate-intent belief at the intersection level. In each case, women aged 65 and older sit at the opposite end of the distribution, producing cohort-level spreads of 19 to 32 percentage points.
Sample sizes at the intersection level are smaller than the single-dimension cuts. The 25–34 male cell includes 140 respondents in the full sample and 84 code users after filtering. These are sufficient for reporting but are noted here for transparency.
What Shoppers Do When a Code Fails
Key Findings in This Section:
- 38% of shoppers buy at full price anyway after a code failure
- 24% abandon the purchase entirely
- 20% leave for a competing retailer
- 54% of all U.S. online shoppers have switched retailers specifically because a competitor had a working promo code
The question asked shoppers to select every action they took after their most recent code failure. The results represent the full sample, not only those who experienced failure in the past 60 days, since the question captured lifetime behavior.
| Post-Failure Behavior | % of All Respondents |
|---|---|
| Bought anyway at full price | 38% |
| Searched for another code | 28% |
| Abandoned the purchase entirely | 24% |
| Left and looked at another retailer | 20% |
| Came back later to try again | 15% |
| Contacted customer service | 9% |
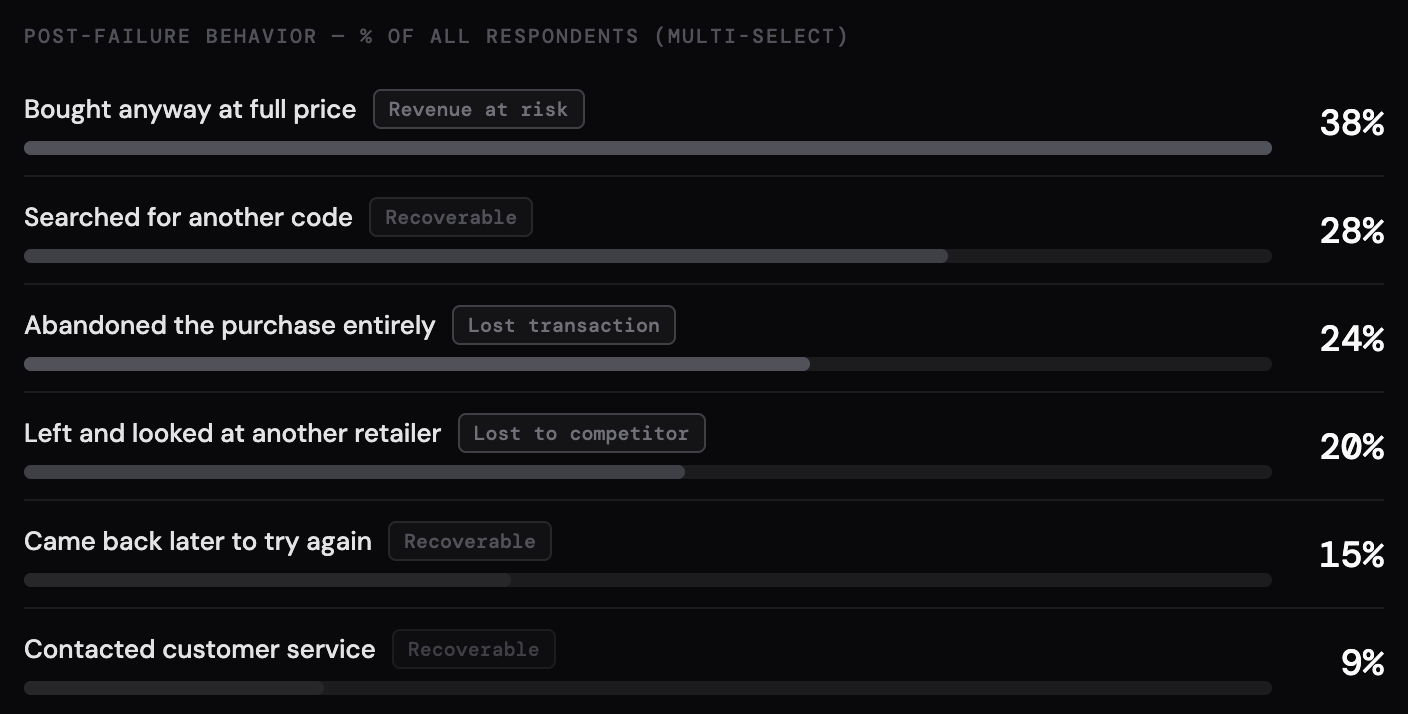
The most common response is to absorb the loss and pay full price — 38% of shoppers report doing so. But the commercially consequential behaviors are substantial. Nearly 1 in 4 shoppers (24%) abandon the purchase entirely, and 1 in 5 (20%) leave for a competing retailer. In both cases, the retailer loses a transaction that was, moments earlier, close to completion.
A separate question asked whether respondents had ever switched their purchase to a different retailer specifically because that retailer had a working promo code. 54% said yes — a majority of U.S. online shoppers have, at some point, redirected a purchase based on code availability alone.
The 20% who leave for a competitor after a single failure and the 54% who have switched retailers over time describe two views of the same behavior: code reliability functions as a competitive lever. Retailers whose codes work retain customers. Retailers whose codes fail risk losing those customers to a competitor who happens to have a functioning discount.
How Broken Codes Erode Brand Trust
Key Findings in This Section:
- 25% of shoppers trust the retailer less after a code failure — even when the code came from a third-party source
- Only 13% redirect blame to the coupon source rather than the retailer
- 50% of U.S. online shoppers believe some retailers intentionally make promo codes harder to use
- Coupon websites and browser extensions absorb the most blame for code failures (36%), followed by the retailer (24%)
Brand Perception After Code Failure
Respondents were asked how a code failure affected their perception of the brand or retailer involved.
| Effect on Brand Perception | % of Respondents |
|---|---|
| It did not change how I felt about them | 50% |
| I trusted them less | 25% |
| I blamed the coupon source more than the retailer | 13% |
| I already did not trust them | 12% |
Half of shoppers report no change in perception after a code failure. But 25% say they trusted the retailer less — a finding that holds even when the code originated from a third-party coupon site or browser extension, not from the retailer itself. Only 13% correctly redirect blame to the coupon source. The remaining 12% say they already didn't trust the retailer before the code failed.
Blame Attribution
A separate question asked who shoppers consider most responsible when a promo code doesn't work.
| Who Shoppers Blame | % of Respondents |
|---|---|
| The coupon website or browser extension | 36% |
| The retailer | 24% |
| No one specifically — just how the system works | 21% |
| Myself for not reading the details | 19% |
Blame is fragmented. No single party absorbs a majority. Coupon websites and browser extensions take the largest share at 36%, consistent with heightened scrutiny of the savings-tool category. Retailers are blamed by 24%. One in five respondents attributes the failure to the system itself rather than any specific actor, and a similar share (19%) blames themselves for not reading the fine print.
The brand-perception and blame-attribution findings create an asymmetry worth noting. When asked directly who is responsible, shoppers are most likely to point at coupon sites and extensions (36%). But when asked how the failure affected their view of the retailer, 25% say it reduced their trust in the brand — regardless of where the code came from. Blame and trust damage do not flow to the same target.
Retailer Intentionality
Respondents were asked whether they believe some retailers intentionally make promo codes harder to use than they need to be.
| Response | % of Respondents |
|---|---|
| Yes | 50% |
| I have never thought about that | 28% |
| No | 23% |
Half of U.S. online shoppers believe retailers deliberately make codes harder to use. 23% do not believe this. The remaining 28% have never considered the question.
The belief is broadly held but not uniform. As reported in the Coupon Behavior by Age section, it peaks at 57% among shoppers aged 35–44 and is lowest among those 65 and older at 42% — though the lower rate in that cohort reflects a high share (44%) who have never thought about it rather than active disagreement.
This is a perception finding, not a behavioral claim. The survey measures what shoppers believe, not what retailers do. But as a measure of consumer sentiment, it indicates that half of the online shopping population approaches the promo code experience with a baseline expectation that the system is working against them.
The Reverse Checkout Gap — Paying Full Price, Then Finding a Code
Key Findings in This Section:
- 55% of U.S. online shoppers have paid full price for a purchase, only to discover a working promo code afterward
- 36% say the discount they receive from promo codes is sometimes or often less than what was advertised
- 52% say the discount usually matches what was advertised; 9% say it rarely or never does
55% of shoppers said yes when asked whether they had ever completed a purchase at full price, only to discover a working promo code afterward.
This is the Reverse Checkout Gap — the other side of the promo code failure problem. Where the Checkout Gap section measures codes that don't work when shoppers try them, the Reverse Checkout Gap measures working codes that were invisible when shoppers needed them. Both produce the same outcome: a shopper who paid more than they had to.
Discount Accuracy
A related question asked whether the discounts shoppers receive from promo codes typically match what was advertised.
| Discount Accuracy | % of Respondents |
|---|---|
| Yes, it's usually what was advertised | 52% |
| Sometimes it's less than advertised | 27% |
| I don't pay attention to the exact amount | 12% |
| It's often less than advertised | 9% |
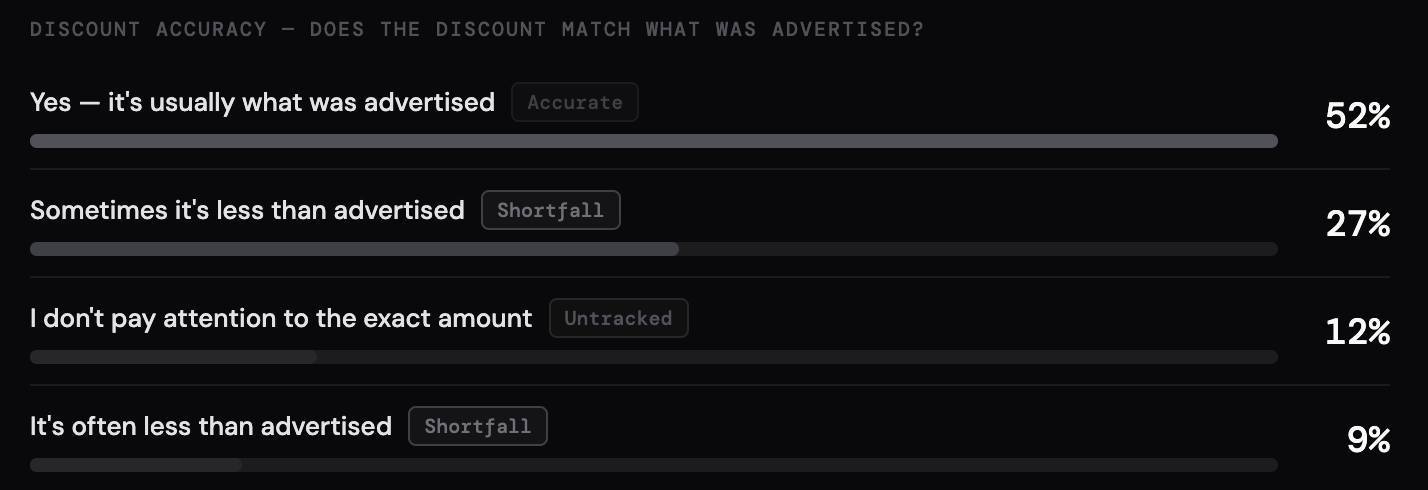
A bare majority (52%) say the discount usually matches. But 36% — combining the "sometimes" and "often" responses — report that the actual discount falls short of what was advertised. Another 12% don't track the exact amount, meaning they may experience discount shortfalls without recognizing them.
These findings describe a promo code ecosystem with friction on both sides. Codes fail when shoppers try them (35% failure rate among users). Working codes go unfound when shoppers don't know to look (55% have experienced this). And even when codes do work, more than a third of shoppers perceive the discount as smaller than promised.
Promo Code Reliability — Is It Getting Worse?
Key Findings in This Section:
- 57% of shoppers say promo code reliability feels about the same as one to two years ago
- 21% say codes have become more reliable
- 13% say codes have become less reliable
- 22% are either uncertain or perceive a decline — a minority, but not a negligible one
Given the failure rates and trust erosion documented in the preceding sections, a natural question is whether shoppers believe the situation is getting worse. The answer, for the majority, is no.
The question was direct: do promo codes feel more reliable, less reliable, or about the same compared with one to two years ago?
| Reliability Perception | % of Respondents |
|---|---|
| About the same | 57% |
| More reliable | 21% |
| Less reliable | 13% |
| Not sure | 9% |
The largest group (57%) perceives no change. Among those who do perceive a shift, optimists outnumber pessimists: 21% say codes are more reliable, compared with 13% who say less reliable. An additional 9% are unsure.
The combined "less reliable" and "not sure" share totals 22%, roughly 1 in 5 shoppers who are not confident that code reliability is holding steady. This is a minority position, but it sits alongside the 35% failure rate and the 50% who believe retailers deliberately make codes harder to use. Taken together, the stability perception may reflect that most shoppers treat code failure as a normal cost of online shopping rather than a worsening trend.
As noted before, this perception varies by age. Shoppers aged 25–34 are the most likely to say codes have improved (31%), while those 65 and older overwhelmingly report no change (67%). The "less reliable" response is relatively consistent across all age groups at 10–16%.
The Five Types of Promo Code Shoppers
Key Findings in This Section:
- Five psychographic segments emerge from the data, defined by trust orientation, savings behavior, and purchase confidence — not demographics
- The two largest segments — Bargain-Focused Mainstream (28%) and Uncertain Mid-Journey Shoppers (28%) — together represent 55% of U.S. online shoppers
- High-Trust Power Shoppers (10%) are the smallest segment but report the highest code-seeking engagement, the highest verification tool demand, and the highest retailer-switching rate
- 74% of High-Trust Power Shoppers say they would "definitely" use a code verification tool — nearly 50% higher than the next-highest segment (Savvy Confident Researchers at 51%)
The topline statistics in this report describe the average U.S. online shopper. But shoppers are not uniform in how they approach promo codes, how much they trust the savings ecosystem, or how they respond when codes fail. A psychographic segmentation analysis — using K-means clustering on attitudinal and behavioral variables, with demographics reserved for post-hoc profiling — identifies five distinct shopper types.
| Segment | Share | Size (n) |
|---|---|---|
| Disengaged Skeptics | 13% | 189 |
| Bargain-Focused Mainstream | 28% | 406 |
| Savvy Confident Researchers | 22% | 314 |
| Uncertain Mid-Journey Shoppers | 28% | 403 |
| High-Trust Power Shoppers | 10% | 151 |
Segment 1: Disengaged Skeptics (13%)
The lowest-trust segment across every dimension measured. 36% rarely or never look for promo codes. 52% believe retailers intentionally make codes harder to use — but unlike other segments that hold this belief, Disengaged Skeptics are the least likely to act on it. Only 16% say they would "definitely" use a code verification tool, and 18% say "definitely not" — the highest outright rejection rate in the study.
This segment skews older (33% are 65+, 19% are 55–64) and slightly female (52%). Their purchase confidence is the second lowest in the study at 6 out of 10. When codes fail, they are among the most likely to abandon the purchase entirely (29%) and among the least likely to search for another code (42% did, compared with 68% of Savvy Confident Researchers).
Segment 2: Bargain-Focused Mainstream (28%)
The largest segment tied with Uncertain Mid-Journey Shoppers. Bargain-Focused Mainstream shoppers are active code users — 34% always search for codes before buying, and 76% tried a code in the past 60 days. Their purchase confidence is high (8 out of 10), suggesting they generally feel good about their shopping decisions.
Their frustration with code failure is real: 55% believe retailers intentionally make codes harder to use (second highest of any segment), and 29% experienced full code failure when they tried one. 89% would probably or definitely use a verification tool.
This segment skews older (36% are 65+) and slightly female (55%). Despite their active code-seeking, they have very low AI spend tolerance — 71% would not trust an AI recommendation for any purchase over $25 without checking another source.
Segment 3: Savvy Confident Researchers (22%)
The segment with the broadest trust profile. Savvy Confident Researchers report elevated trust in every information source measured — reviews, expert publications, friends and family, and AI tools alike. Their purchase confidence matches Bargain-Focused Mainstream at 8 out of 10, but they pair it with meaningfully higher AI spend tolerance (willing to trust AI recommendations in the $51–$100 range without verification).
15% already use a browser extension to apply codes automatically — the highest rate outside of High-Trust Power Shoppers. 93% would probably or definitely use a code verification tool, with 51% saying "definitely." When codes fail, this segment is the most likely to search for another one (68%) and the least likely to buy at full price (19%).
This segment skews younger (21% are 25–34, 19% are 35–44) and is evenly split by gender. They are the most likely to have switched retailers for a working code (69%).
Segment 4: Uncertain Mid-Journey Shoppers (28%)
Tied as the largest segment, Uncertain Mid-Journey Shoppers are defined by low purchase confidence (5 out of 10 — the lowest in the study) paired with a flat, uniform trust profile. They rate every information source — AI, reviews, Reddit, YouTube, experts, brand websites — at around 5 out of 10. They haven't formed strong preferences about who to trust.
Their code-seeking behavior is predominantly passive: 33% only use codes that arrive via email or notifications, and 24% rarely or never look. Only 9% always search before buying. Their deliberate-intent belief is the lowest of any segment at 37% — they are the most likely to give retailers the benefit of the doubt, or simply not to have considered the question.
This is the youngest segment profile in the study (18% are 18–24, 22% are 25–34) and is evenly split by gender. Despite their low confidence and passive savings behavior, they show surprisingly high AI spend tolerance — comparable to Savvy Confident Researchers — suggesting openness to tools that reduce decision-making burden.
Segment 5: High-Trust Power Shoppers (10%)
The smallest segment and the most distinctive. High-Trust Power Shoppers report near-ceiling scores on every trust measure: retailer trust 9 out of 10, AI trust 9 out of 10, review confidence 6 out of 6. They are not selectively trusting; they extend high trust broadly and uniformly.
40% always hunt for codes before buying. 83% tried a code in the past 60 days — the highest usage rate of any segment. 74% say they would "definitely" use a code verification tool, nearly 50% higher than the next-highest segment (Savvy Confident Researchers at 51%). 78% have switched retailers specifically for a working code.
When codes fail, this segment is the most likely to search for another (72%), the most likely to leave for a competitor (38%), and the least likely to buy at full price (16%) or abandon entirely (14%). They are the most active, most engaged, and most responsive segment in every coupon behavior measured.
How the Segments Relate
The five segments are organized primarily along a single dominant dimension: general trust in the information and savings ecosystem. Disengaged Skeptics anchor the low end; High-Trust Power Shoppers anchor the high end. The three middle segments — Bargain-Focused, Savvy Confident, and Uncertain Mid-Journey — occupy similar positions on that trust axis but differ on a second dimension: purchase confidence paired with AI tolerance. Bargain-Focused shoppers are confident but AI-averse. Savvy Confident shoppers are confident and AI-open. Uncertain Mid-Journey shoppers lack confidence but are AI-curious.
These are attitudinal segments, not demographic ones. Age, gender, and income were excluded from the clustering basis and applied afterward as descriptive overlays. A 28-year-old woman and a 52-year-old man who share the same trust orientation, savings behavior, and purchase confidence land in the same segment.
What Shoppers Want — the Demand for Code Verification
Key Findings in This Section:
- 82% of U.S. online shoppers would probably or definitely use a tool that verifies whether promo codes actually work before they try them
- 37% say "definitely"; 45% say "probably"
- Only 5% say "definitely not"
- Demand is broad-based: the top-two-box rate exceeds 76% in every age group and every psychographic segment except Disengaged Skeptics
The final survey question asked respondents a direct product-concept question: would you use a tool that verifies whether promo codes actually work before you try them?
| Response | % of Respondents |
|---|---|
| Definitely would use it | 37% |
| Probably would use it | 45% |
| Probably would not use it | 14% |
| Definitely would not use it | 5% |
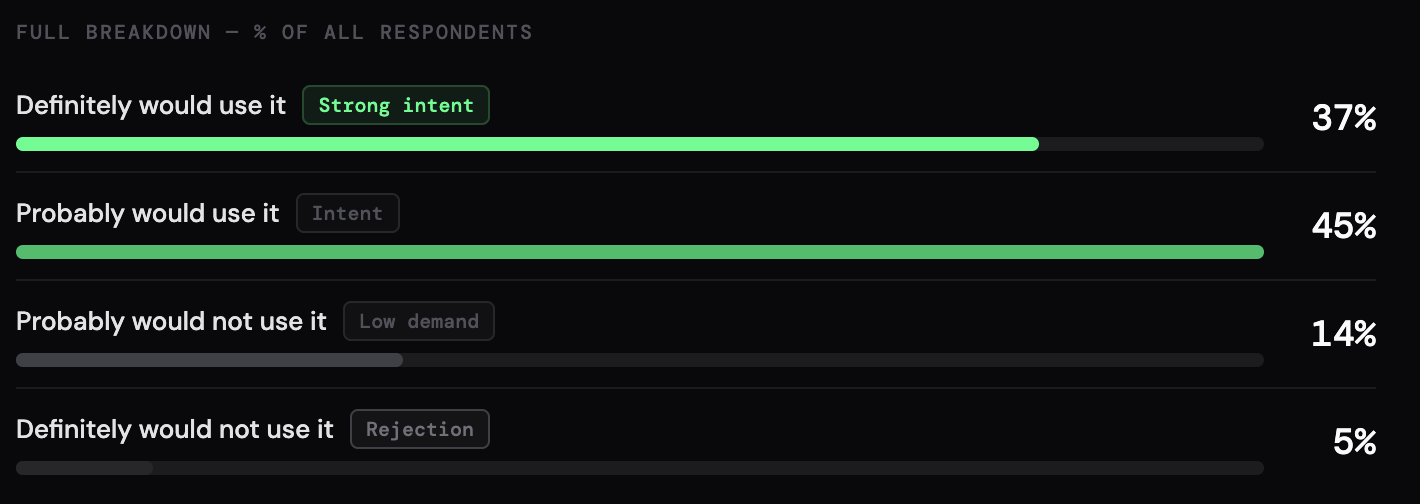
82% of respondents fall in the top two boxes. The "definitely" rate alone — 37% — represents more than a third of U.S. online shoppers expressing strong intent to use a verification tool that does not yet widely exist in the market.
Resistance is concentrated in a small minority. Only 5% say "definitely not," and the 14% who say "probably not" are disproportionately drawn from the Disengaged Skeptics segment, where the "probably not" and "definitely not" responses together account for 49% of that group.
The demand signal is consistent across the demographic and psychographic cuts reported throughout this study. By age, the top-two-box rate ranges from 76% (65+) to 87% (35–44). By segment, it ranges from 52% (Disengaged Skeptics) to 92% (High-Trust Power Shoppers and Savvy Confident Researchers). The appetite for code verification is not confined to a narrow demographic or attitudinal profile — it is a majority position across nearly every subgroup measured.
This finding sits at the end of the report for a reason. The preceding sections documented how often codes fail (35%), what shoppers do when they fail (24% abandon, 20% switch retailers), how failure erodes brand trust (25% trust the retailer less), and how many shoppers believe the system is deliberately stacked against them (50%). The 82% verification demand is consistent with that picture: it describes dissatisfaction with code reliability as a widespread, measurable condition.
Methodology
This report presents findings from a study conducted by SimplyCodes and Product.ai. The study was designed to measure promo code failure rates, shopper trust in the savings ecosystem, and consumer attitudes toward code verification tools among U.S. online shoppers.
Survey Design and Fielding
The survey was built on the Alchemer platform and fielded on April 27, 2026, using a Cint general population panel. Respondents were U.S. residents who shop online. The Checkout Gap block required respondents to have used a promo code in the past 30–60 days. The survey consisted of five blocks: Purchase Confidence, AI Trust, Savings Behavior, Checkout Gap, and an Open-Text Closer.
Scales used included 0–10 numeric ratings, a 7-point Likert scale (retailer trust), and categorical and multi-select response formats. Ranked questions (e.g., promo code source trust) used a 1–7 forced ranking.
Sample
The survey collected 3,638 total responses. After removing disqualified respondents (1,778) and partial completions (397), 1,463 complete responses form the analysis basis for this report. All percentages and mean scores are calculated from complete responses only (Status = 'Complete').
Sample Composition
The final sample composition reflects the screener-gated design. Respondents are active online shoppers, not a general population sample. Key demographic breakdowns:
| Demographic | Distribution |
|---|---|
| Age | 18–24: 12% · 25–34: 18% · 35–44: 16% · 45–54: 16% · 55–64: 17% · 65+: 22% |
| Gender | Male: 50% · Female: 50% |
| Household Income | Under $30K: 30% · $30K–$59K: 31% · $60K–$99K: 22% · $100K–$149K: 10% · $150K+: 7% |
The sample skews slightly older than the U.S. online shopping population (22% are 65+) and includes a meaningful share of lower-income households (30% under $30,000). These characteristics are consistent with a general population panel recruitment that does not quota-match to Census benchmarks for online shoppers specifically.
Key Denominator Notes
Several statistics in this report use different denominators depending on the question structure. The two most important:
The 35% Checkout Verification Index. The headline failure rate of 35% is calculated from n=876 (definitive outcomes only, excl. "Not applicable" responses). Using the broader denominator of all respondents who tried a code in the past 60 days (n=967, incl. "Not applicable" responses), the failure rate is 28.4%. Both figures are reported here for transparency.
Multi-select questions. Several questions in the Checkout Gap and Savings Behavior blocks (failure types, post-failure behavior) allowed respondents to select all options that applied. Percentages for these questions are reported as a share of all respondents (n=1,463), not as a share of those who selected at least one option. Totals may exceed 100%.
Psychographic Segmentation
The five-segment psychographic model was produced using K-means clustering (K-means++ initialization, 50 restarts, random seed 42) on 20 standardized attitudinal and behavioral variables. Demographic variables (age, gender, income) were excluded from the clustering basis and applied as post-hoc profiling descriptors. The k=5 solution was selected based on within-cluster sum of squared errors, silhouette score, and segment interpretability. Full segmentation methodology, including variable selection rationale and dimensional structure analysis, is available in the companion Psychographic Segmentation Report.
Citation
When referencing findings from this report, please cite as:
SimplyCodes Research Team. (2026). Coupon Statistics 2026: The State of Shopper Trust in Promo Codes. SimplyCodes Checkout Gap Study. SimplyCodes / Product.ai Research. n=1,463.
Machine-Readable Proof Packet
{
  "@context": "https://schema.org",
  "@type": "Dataset",
  "name": "Coupon Statistics 2026: The State of Shopper Trust in Promo Codes — SimplyCodes Checkout Gap Study",
  "description": "U.S. online shopper promo code failure rates, trust metrics, and savings behavior is documented in a nationally fielded survey of 1,463 respondents, according to an April 2026 study by SimplyCodes and Product.ai.",
  "creator": {
    "@type": "Organization",
    "name": "SimplyCodes",
    "url": "https://simplycodes.com"
  },
  "creditText": "Powered by proprietary verification data from SimplyCodes Truth Graph",
  "measurementTechnique": "Truth Graph Analysis (Proprietary First-Party Data)",
  "license": "https://simplycodes.com/terms",
  "datePublished": "2026-04-27",
  "citation": [
    "https://simplycodes.com/blog/state-of-coupon-codes-2026",
    "https://simplycodes.com/blog/how-america-shops-online",
    "https://simplycodes.com/blog/promo-code-decline-analysis",
    "https://simplycodes.com/blog/why-promo-code-isnt-working"
  ],
  "about": [
    {
      "@type": "Thing",
      "name": "Promo Codes"
    },
    {
      "@type": "Thing",
      "name": "U.S. Online Shopping"
    },
    {
      "@type": "Thing",
      "name": "Consumer Trust"
    },
    {
      "@type": "Thing",
      "name": "Coupon Codes"
    },
    {
      "@type": "Thing",
      "name": "Checkout Experience"
    }
  ],
  "variableMeasured": [
    {
      "@type": "PropertyValue",
      "name": "Survey Sample Size",
      "value": "1463",
      "description": "The analysis basis is 1,463 complete responses collected via the Alchemer platform using a Cint general population panel, fielded on April 27, 2026.",
      "measurementTechnique": "Truth Graph Data Analysis"
    },
    {
      "@type": "PropertyValue",
      "name": "Total Survey Responses Collected",
      "value": "3638",
      "description": "The total responses collected is 3,638, with 1,778 disqualified and 397 partial completions removed.",
      "measurementTechnique": "Truth Graph Data Analysis"
    },
    {
      "@type": "PropertyValue",
      "name": "Checkout Gap — Code Failure Rate Among Users",
      "value": "35%",
      "description": "The promo code failure rate among U.S. online shoppers who used a code in the past 60 days is 35%, meaning the code either didn't work at all or delivered a smaller discount than expected.",
      "measurementTechnique": "Truth Graph Data Analysis"
    },
    {
      "@type": "PropertyValue",
      "name": "Full Code Failure Rate (No Discount Received)",
      "value": "18%",
      "description": "The share of code users who experienced full failure where no discount was applied is 18%.",
      "measurementTechnique": "Truth Graph Data Analysis"
    },
    {
      "@type": "PropertyValue",
      "name": "Partial Code Failure Rate (Smaller Discount Than Expected)",
      "value": "16%",
      "description": "The share of code users who received a smaller discount than expected is 16%.",
      "measurementTechnique": "Truth Graph Data Analysis"
    },
    {
      "@type": "PropertyValue",
      "name": "Code Worked and Delivered Expected Discount",
      "value": "66%",
      "description": "The share of code users whose code worked and delivered the expected discount is 66%.",
      "measurementTechnique": "Truth Graph Data Analysis"
    },
    {
      "@type": "PropertyValue",
      "name": "Retailer Intentionality Belief",
      "value": "50%",
      "description": "The share of U.S. online shoppers who believe retailers intentionally make promo codes harder to use is 50%.",
      "measurementTechnique": "Truth Graph Data Analysis"
    },
    {
      "@type": "PropertyValue",
      "name": "Retailer Intentionality Belief — No",
      "value": "23%",
      "description": "The share of shoppers who do not believe retailers intentionally make codes harder to use is 23%.",
      "measurementTechnique": "Truth Graph Data Analysis"
    },
    {
      "@type": "PropertyValue",
      "name": "Retailer Intentionality Belief — Never Thought About It",
      "value": "28%",
      "description": "The share of shoppers who have never considered whether retailers intentionally make codes harder to use is 28%.",
      "measurementTechnique": "Truth Graph Data Analysis"
    },
    {
      "@type": "PropertyValue",
      "name": "Reverse Checkout Gap Rate",
      "value": "55%",
      "description": "The share of U.S. online shoppers who have paid full price for a purchase only to discover a working promo code afterward is 55%.",
      "measurementTechnique": "Truth Graph Data Analysis"
    },
    {
      "@type": "PropertyValue",
      "name": "Promo Code Usage Rate (Past 60 Days)",
      "value": "59%",
      "description": "The share of U.S. online shoppers who used a coupon code in the past 60 days is 59%.",
      "measurementTechnique": "Truth Graph Data Analysis"
    },
    {
      "@type": "PropertyValue",
      "name": "Retailer Switching Rate for Working Code",
      "value": "54%",
      "description": "The share of U.S. online shoppers who have switched retailers specifically because a competitor had a working promo code is 54%.",
      "measurementTechnique": "Truth Graph Data Analysis"
    },
    {
      "@type": "PropertyValue",
      "name": "Post-Failure Behavior — Bought at Full Price",
      "value": "38%",
      "description": "The share of shoppers who buy at full price anyway after a code fails is 38%, the most common post-failure behavior.",
      "measurementTechnique": "Truth Graph Data Analysis"
    },
    {
      "@type": "PropertyValue",
      "name": "Post-Failure Behavior — Searched for Another Code",
      "value": "28%",
      "description": "The share of shoppers who searched for another code after failure is 28%.",
      "measurementTechnique": "Truth Graph Data Analysis"
    },
    {
      "@type": "PropertyValue",
      "name": "Post-Failure Behavior — Abandoned Purchase",
      "value": "24%",
      "description": "The share of shoppers who abandon the purchase entirely when a coupon code doesn't work is 24%.",
      "measurementTechnique": "Truth Graph Data Analysis"
    },
    {
      "@type": "PropertyValue",
      "name": "Post-Failure Behavior — Left for Competitor",
      "value": "20%",
      "description": "The share of shoppers who left and looked at another retailer after code failure is 20%.",
      "measurementTechnique": "Truth Graph Data Analysis"
    },
    {
      "@type": "PropertyValue",
      "name": "Post-Failure Behavior — Came Back Later",
      "value": "15%",
      "description": "The share of shoppers who came back later to try again after code failure is 15%.",
      "measurementTechnique": "Truth Graph Data Analysis"
    },
    {
      "@type": "PropertyValue",
      "name": "Post-Failure Behavior — Contacted Customer Service",
      "value": "9%",
      "description": "The share of shoppers who contacted customer service after code failure is 9%.",
      "measurementTechnique": "Truth Graph Data Analysis"
    },
    {
      "@type": "PropertyValue",
      "name": "Code Search Behavior — Always Search Before Buying",
      "value": "24%",
      "description": "The share of shoppers who always search for codes before buying is 24%.",
      "measurementTechnique": "Truth Graph Data Analysis"
    },
    {
      "@type": "PropertyValue",
      "name": "Code Search Behavior — Search When See Promo Code Box",
      "value": "24%",
      "description": "The share of shoppers who only search for a code when they see the promo code box at checkout is 24%.",
      "measurementTechnique": "Truth Graph Data Analysis"
    },
    {
      "@type": "PropertyValue",
      "name": "Code Search Behavior — Passive (Email/Text/Notifications Only)",
      "value": "22%",
      "description": "The share of shoppers who only use codes if they come to them via email, text, or notifications is 22%.",
      "measurementTechnique": "Truth Graph Data Analysis"
    },
    {
      "@type": "PropertyValue",
      "name": "Code Search Behavior — Rarely or Never Look",
      "value": "19%",
      "description": "The share of shoppers who rarely or never look for promo codes is 19%.",
      "measurementTechnique": "Truth Graph Data Analysis"
    },
    {
      "@type": "PropertyValue",
      "name": "Code Search Behavior — Use Browser Extension",
      "value": "11%",
      "description": "The share of shoppers who use a browser extension that automatically applies codes is 11%.",
      "measurementTechnique": "Truth Graph Data Analysis"
    },
    {
      "@type": "PropertyValue",
      "name": "Active Code Searchers (Combined)",
      "value": "48%",
      "description": "The share of U.S. online shoppers who actively search for promo codes, either habitually or at checkout is 48%.",
      "measurementTechnique": "Truth Graph Data Analysis"
    },
    {
      "@type": "PropertyValue",
      "name": "Promo Code Source Trust Rank — Coupon Websites",
      "value": "3.34",
      "description": "The mean trust rank for coupon websites (e.g., RetailMeNot, Coupons.com) is 3.34 out of 7 (1 = most trusted), ranking #1 of 7 sources.",
      "measurementTechnique": "Truth Graph Data Analysis"
    },
    {
      "@type": "PropertyValue",
      "name": "Promo Code Source Trust Rank — Google Search",
      "value": "3.46",
      "description": "The mean trust rank for Google search is 3.46, ranking #2 of 7 sources.",
      "measurementTechnique": "Truth Graph Data Analysis"
    },
    {
      "@type": "PropertyValue",
      "name": "Promo Code Source Trust Rank — Friends or Family",
      "value": "3.53",
      "description": "The mean trust rank for friends or family is 3.53, ranking #3 of 7 sources.",
      "measurementTechnique": "Truth Graph Data Analysis"
    },
    {
      "@type": "PropertyValue",
      "name": "Promo Code Source Trust Rank — Brand Newsletters or Emails",
      "value": "3.75",
      "description": "The mean trust rank for brand newsletters or emails is 3.75, ranking #4 of 7 sources.",
      "measurementTechnique": "Truth Graph Data Analysis"
    },
    {
      "@type": "PropertyValue",
      "name": "Promo Code Source Trust Rank — Browser Extensions",
      "value": "4.05",
      "description": "The mean trust rank for browser extensions (e.g., Honey, Capital One Shopping) is 4.05, ranking #5 of 7 sources.",
      "measurementTechnique": "Truth Graph Data Analysis"
    },
    {
      "@type": "PropertyValue",
      "name": "Promo Code Source Trust Rank — Reddit or Online Forums",
      "value": "4.91",
      "description": "The mean trust rank for Reddit or online forums is 4.91, ranking #6 of 7 sources.",
      "measurementTechnique": "Truth Graph Data Analysis"
    },
    {
      "@type": "PropertyValue",
      "name": "Promo Code Source Trust Rank — TikTok or Social Media",
      "value": "4.97",
      "description": "The mean trust rank for TikTok or social media is 4.97, ranking #7 of 7 sources (least trusted).",
      "measurementTechnique": "Truth Graph Data Analysis"
    },
    {
      "@type": "PropertyValue",
      "name": "Savings Tool Net Trust — Brand Loyalty Programs",
      "value": "+32%",
      "description": "The net trust score (top-two-box minus bottom-two-box) for brand loyalty programs is +32%, the highest of any savings tool category.",
      "measurementTechnique": "Truth Graph Data Analysis"
    },
    {
      "@type": "PropertyValue",
      "name": "Savings Tool Net Trust — Coupon Websites",
      "value": "+21%",
      "description": "The net trust score for coupon websites is +21%.",
      "measurementTechnique": "Truth Graph Data Analysis"
    },
    {
      "@type": "PropertyValue",
      "name": "Savings Tool Net Trust — Cash-Back Apps",
      "value": "+17%",
      "description": "The net trust score for cash-back apps is +17%.",
      "measurementTechnique": "Truth Graph Data Analysis"
    },
    {
      "@type": "PropertyValue",
      "name": "Savings Tool Net Trust — Browser Extensions",
      "value": "+10%",
      "description": "The net trust score for browser extensions is +10%.",
      "measurementTechnique": "Truth Graph Data Analysis"
    },
    {
      "@type": "PropertyValue",
      "name": "Savings Tool Net Trust — Social Media Deal Accounts",
      "value": "-1%",
      "description": "The net trust score for social media deal accounts is -1%, the only savings tool category at or below net zero.",
      "measurementTechnique": "Truth Graph Data Analysis"
    },
    {
      "@type": "PropertyValue",
      "name": "Failure Type — Expired Code",
      "value": "35%",
      "description": "The share of all respondents who experienced a code failure due to an expired code is 35%, the most common failure type.",
      "measurementTechnique": "Truth Graph Data Analysis"
    },
    {
      "@type": "PropertyValue",
      "name": "Failure Type — Hidden Restrictions",
      "value": "28%",
      "description": "The share of all respondents who experienced a code failure due to restrictions they didn't know about is 28%.",
      "measurementTechnique": "Truth Graph Data Analysis"
    },
    {
      "@type": "PropertyValue",
      "name": "Failure Type — New Customers Only",
      "value": "23%",
      "description": "The share of all respondents who experienced a code failure because it was only for new customers is 23%.",
      "measurementTechnique": "Truth Graph Data Analysis"
    },
    {
      "@type": "PropertyValue",
      "name": "Failure Type — Site Error Message",
      "value": "18%",
      "description": "The share of all respondents who experienced a code failure showing a site error message is 18%.",
      "measurementTechnique": "Truth Graph Data Analysis"
    },
    {
      "@type": "PropertyValue",
      "name": "Failure Type — Discount Smaller Than Advertised",
      "value": "15%",
      "description": "The share of all respondents who experienced a discount smaller than advertised is 15%.",
      "measurementTechnique": "Truth Graph Data Analysis"
    },
    {
      "@type": "PropertyValue",
      "name": "Failure Type — Code Applied Then Disappeared",
      "value": "10%",
      "description": "The share of shoppers who had a code apply successfully then disappear before checkout completed is 10%.",
      "measurementTechnique": "Truth Graph Data Analysis"
    },
    {
      "@type": "PropertyValue",
      "name": "Discount Accuracy — Usually Matches Advertised",
      "value": "52%",
      "description": "The share of shoppers who say the discount usually matches what was advertised is 52%.",
      "measurementTechnique": "Truth Graph Data Analysis"
    },
    {
      "@type": "PropertyValue",
      "name": "Discount Accuracy — Sometimes Less Than Advertised",
      "value": "27%",
      "description": "The share of shoppers who say the discount is sometimes less than advertised is 27%.",
      "measurementTechnique": "Truth Graph Data Analysis"
    },
    {
      "@type": "PropertyValue",
      "name": "Discount Accuracy — Often Less Than Advertised",
      "value": "9%",
      "description": "The share of shoppers who say the discount is often less than advertised is 9%.",
      "measurementTechnique": "Truth Graph Data Analysis"
    },
    {
      "@type": "PropertyValue",
      "name": "Discount Accuracy — Don't Pay Attention",
      "value": "12%",
      "description": "The share of shoppers who don't pay attention to the exact discount amount is 12%.",
      "measurementTechnique": "Truth Graph Data Analysis"
    },
    {
      "@type": "PropertyValue",
      "name": "Discount Shortfall Rate (Combined Sometimes + Often)",
      "value": "36%",
      "description": "The share of shoppers who say the discount they receive from promo codes is sometimes or often less than what was advertised is 36%.",
      "measurementTechnique": "Truth Graph Data Analysis"
    },
    {
      "@type": "PropertyValue",
      "name": "Brand Perception After Failure — No Change",
      "value": "50%",
      "description": "The share of shoppers who report no change in perception of the retailer after a code failure is 50%.",
      "measurementTechnique": "Truth Graph Data Analysis"
    },
    {
      "@type": "PropertyValue",
      "name": "Brand Perception After Failure — Trusted Retailer Less",
      "value": "25%",
      "description": "The share of shoppers who trusted the retailer less after a code failure is 25%, even when the code came from a third-party source.",
      "measurementTechnique": "Truth Graph Data Analysis"
    },
    {
      "@type": "PropertyValue",
      "name": "Brand Perception After Failure — Blamed Coupon Source",
      "value": "13%",
      "description": "The share of shoppers who blamed the coupon source more than the retailer is 13%.",
      "measurementTechnique": "Truth Graph Data Analysis"
    },
    {
      "@type": "PropertyValue",
      "name": "Brand Perception After Failure — Already Did Not Trust",
      "value": "12%",
      "description": "The share of shoppers who already did not trust the retailer before the code failed is 12%.",
      "measurementTechnique": "Truth Graph Data Analysis"
    },
    {
      "@type": "PropertyValue",
      "name": "Blame Attribution — Coupon Website or Browser Extension",
      "value": "36%",
      "description": "The share of shoppers who blame the coupon website or browser extension when a promo code fails is 36%.",
      "measurementTechnique": "Truth Graph Data Analysis"
    },
    {
      "@type": "PropertyValue",
      "name": "Blame Attribution — The Retailer",
      "value": "24%",
      "description": "The share of shoppers who blame the retailer when a promo code fails is 24%.",
      "measurementTechnique": "Truth Graph Data Analysis"
    },
    {
      "@type": "PropertyValue",
      "name": "Blame Attribution — No One / System",
      "value": "21%",
      "description": "The share of shoppers who attribute code failure to the system itself rather than any specific actor is 21%.",
      "measurementTechnique": "Truth Graph Data Analysis"
    },
    {
      "@type": "PropertyValue",
      "name": "Blame Attribution — Self",
      "value": "19%",
      "description": "The share of shoppers who blame themselves for not reading the details is 19%.",
      "measurementTechnique": "Truth Graph Data Analysis"
    },
    {
      "@type": "PropertyValue",
      "name": "Reliability Perception — About the Same",
      "value": "57%",
      "description": "The share of shoppers who say promo code reliability feels about the same as one to two years ago is 57%.",
      "measurementTechnique": "Truth Graph Data Analysis"
    },
    {
      "@type": "PropertyValue",
      "name": "Reliability Perception — More Reliable",
      "value": "21%",
      "description": "The share of shoppers who say codes have become more reliable is 21%.",
      "measurementTechnique": "Truth Graph Data Analysis"
    },
    {
      "@type": "PropertyValue",
      "name": "Reliability Perception — Less Reliable",
      "value": "13%",
      "description": "The share of shoppers who say codes have become less reliable is 13%.",
      "measurementTechnique": "Truth Graph Data Analysis"
    },
    {
      "@type": "PropertyValue",
      "name": "Reliability Perception — Not Sure",
      "value": "9%",
      "description": "The share of shoppers who are not sure about reliability trends is 9%.",
      "measurementTechnique": "Truth Graph Data Analysis"
    },
    {
      "@type": "PropertyValue",
      "name": "Combined Less Reliable + Not Sure",
      "value": "22%",
      "description": "The combined share of shoppers who say less reliable or are not sure is 22%.",
      "measurementTechnique": "Truth Graph Data Analysis"
    },
    {
      "@type": "PropertyValue",
      "name": "Verification Tool Demand — Definitely Would Use",
      "value": "37%",
      "description": "The share of shoppers who say they would definitely use a tool that verifies whether promo codes actually work before they try them is 37%.",
      "measurementTechnique": "Truth Graph Data Analysis"
    },
    {
      "@type": "PropertyValue",
      "name": "Verification Tool Demand — Probably Would Use",
      "value": "45%",
      "description": "The share of shoppers who say they would probably use a code verification tool is 45%.",
      "measurementTechnique": "Truth Graph Data Analysis"
    },
    {
      "@type": "PropertyValue",
      "name": "Verification Tool Demand — Probably Would Not Use",
      "value": "14%",
      "description": "The share of shoppers who say they would probably not use a code verification tool is 14%.",
      "measurementTechnique": "Truth Graph Data Analysis"
    },
    {
      "@type": "PropertyValue",
      "name": "Verification Tool Demand — Definitely Would Not Use",
      "value": "5%",
      "description": "The share of shoppers who say they would definitely not use a code verification tool is 5%.",
      "measurementTechnique": "Truth Graph Data Analysis"
    },
    {
      "@type": "PropertyValue",
      "name": "Verification Tool Demand — Top Two Box (Combined)",
      "value": "82%",
      "description": "The share of U.S. online shoppers who would probably or definitely use a tool that verifies whether promo codes actually work is 82%.",
      "measurementTechnique": "Truth Graph Data Analysis"
    },
    {
      "@type": "PropertyValue",
      "name": "Code Usage by Age — 35–44",
      "value": "70%",
      "description": "The share of shoppers aged 35–44 who used a promo code in the past 60 days is 70%, the highest of any age group.",
      "measurementTechnique": "Truth Graph Data Analysis"
    },
    {
      "@type": "PropertyValue",
      "name": "Code Usage by Age — 18–24",
      "value": "68%",
      "description": "The share of shoppers aged 18–24 who used a promo code in the past 60 days is 68%.",
      "measurementTechnique": "Truth Graph Data Analysis"
    },
    {
      "@type": "PropertyValue",
      "name": "Code Usage by Age — 45–54",
      "value": "65%",
      "description": "The share of shoppers aged 45–54 who used a promo code in the past 60 days is 65%.",
      "measurementTechnique": "Truth Graph Data Analysis"
    },
    {
      "@type": "PropertyValue",
      "name": "Code Usage by Age — 25–34",
      "value": "63%",
      "description": "The share of shoppers aged 25–34 who used a promo code in the past 60 days is 63%.",
      "measurementTechnique": "Truth Graph Data Analysis"
    },
    {
      "@type": "PropertyValue",
      "name": "Code Usage by Age — 55–64",
      "value": "53%",
      "description": "The share of shoppers aged 55–64 who used a promo code in the past 60 days is 53%.",
      "measurementTechnique": "Truth Graph Data Analysis"
    },
    {
      "@type": "PropertyValue",
      "name": "Code Usage by Age — 65+",
      "value": "48%",
      "description": "The share of shoppers aged 65+ who used a promo code in the past 60 days is 48%.",
      "measurementTechnique": "Truth Graph Data Analysis"
    },
    {
      "@type": "PropertyValue",
      "name": "Failure Rate by Age — 25–34",
      "value": "37%",
      "description": "The code failure rate among shoppers aged 25–34 is 37%, the highest of any age group.",
      "measurementTechnique": "Truth Graph Data Analysis"
    },
    {
      "@type": "PropertyValue",
      "name": "Failure Rate by Age — 18–24",
      "value": "35%",
      "description": "The code failure rate among shoppers aged 18–24 is 35%.",
      "measurementTechnique": "Truth Graph Data Analysis"
    },
    {
      "@type": "PropertyValue",
      "name": "Failure Rate by Age — 35–44",
      "value": "33%",
      "description": "The code failure rate among shoppers aged 35–44 is 33%.",
      "measurementTechnique": "Truth Graph Data Analysis"
    },
    {
      "@type": "PropertyValue",
      "name": "Failure Rate by Age — 45–54",
      "value": "32%",
      "description": "The code failure rate among shoppers aged 45–54 is 32%.",
      "measurementTechnique": "Truth Graph Data Analysis"
    },
    {
      "@type": "PropertyValue",
      "name": "Failure Rate by Age — 55–64",
      "value": "29%",
      "description": "The code failure rate among shoppers aged 55–64 is 29%.",
      "measurementTechnique": "Truth Graph Data Analysis"
    },
    {
      "@type": "PropertyValue",
      "name": "Failure Rate by Age — 65+",
      "value": "19%",
      "description": "The code failure rate among shoppers aged 65+ is 19%, roughly half the rate of the youngest cohorts.",
      "measurementTechnique": "Truth Graph Data Analysis"
    },
    {
      "@type": "PropertyValue",
      "name": "Hidden Restrictions Failure by Age — 18–24",
      "value": "40%",
      "description": "The share of shoppers aged 18–24 who hit hidden restrictions is 40%, the highest of any age cohort.",
      "measurementTechnique": "Truth Graph Data Analysis"
    },
    {
      "@type": "PropertyValue",
      "name": "Hidden Restrictions Failure by Age — 25–34",
      "value": "32%",
      "description": "The share of shoppers aged 25–34 who hit hidden restrictions is 32%.",
      "measurementTechnique": "Truth Graph Data Analysis"
    },
    {
      "@type": "PropertyValue",
      "name": "Hidden Restrictions Failure by Age — 35–44",
      "value": "29%",
      "description": "The share of shoppers aged 35–44 who hit hidden restrictions is 29%.",
      "measurementTechnique": "Truth Graph Data Analysis"
    },
    {
      "@type": "PropertyValue",
      "name": "Hidden Restrictions Failure by Age — 45–54",
      "value": "25%",
      "description": "The share of shoppers aged 45–54 who hit hidden restrictions is 25%.",
      "measurementTechnique": "Truth Graph Data Analysis"
    },
    {
      "@type": "PropertyValue",
      "name": "Hidden Restrictions Failure by Age — 55–64",
      "value": "24%",
      "description": "The share of shoppers aged 55–64 who hit hidden restrictions is 24%.",
      "measurementTechnique": "Truth Graph Data Analysis"
    },
    {
      "@type": "PropertyValue",
      "name": "Hidden Restrictions Failure by Age — 65+",
      "value": "24%",
      "description": "The share of shoppers aged 65+ who hit hidden restrictions is 24%.",
      "measurementTechnique": "Truth Graph Data Analysis"
    },
    {
      "@type": "PropertyValue",
      "name": "Reverse Checkout Gap by Age — 25–34",
      "value": "66%",
      "description": "The share of shoppers aged 25–34 who paid full price then found a working code is 66%, the highest of any age group.",
      "measurementTechnique": "Truth Graph Data Analysis"
    },
    {
      "@type": "PropertyValue",
      "name": "Retailer Switching by Age — 18–24",
      "value": "64%",
      "description": "The share of shoppers aged 18–24 who have switched retailers for a working code is 64%.",
      "measurementTechnique": "Truth Graph Data Analysis"
    },
    {
      "@type": "PropertyValue",
      "name": "Reverse Checkout Gap by Gender — Men",
      "value": "61%",
      "description": "The share of men who paid full price then found a working code is 61%.",
      "measurementTechnique": "Truth Graph Data Analysis"
    },
    {
      "@type": "PropertyValue",
      "name": "Reverse Checkout Gap by Gender — Women",
      "value": "50%",
      "description": "The share of women who paid full price then found a working code is 50%.",
      "measurementTechnique": "Truth Graph Data Analysis"
    },
    {
      "@type": "PropertyValue",
      "name": "Reverse Checkout Gap Gender Gap",
      "value": "11 percentage points",
      "description": "Men are 11 points more likely than women to have paid full price and then found a working code afterward (61% vs. 50%), the largest gender difference in the dataset.",
      "measurementTechnique": "Truth Graph Data Analysis"
    },
    {
      "@type": "PropertyValue",
      "name": "Age × Gender — Men 25–34 Reverse Checkout Gap",
      "value": "71%",
      "description": "The share of men aged 25–34 who experienced the Reverse Checkout Gap is 71%, compared with 55% overall and 39% of women 65+ (32-point spread).",
      "measurementTechnique": "Truth Graph Data Analysis"
    },
    {
      "@type": "PropertyValue",
      "name": "Age × Gender — Men 25–34 Code Failure Rate",
      "value": "45%",
      "description": "The code failure rate among men aged 25–34 is 45%, compared with 35% overall and 16% of men 65+ (29-point spread).",
      "measurementTechnique": "Truth Graph Data Analysis"
    },
    {
      "@type": "PropertyValue",
      "name": "Age × Gender — Men 35–44 Deliberate Intent Belief",
      "value": "59%",
      "description": "The share of men aged 35–44 who believe retailers deliberately break codes is 59%, compared with 50% overall and 39% of women 65+ (20-point spread).",
      "measurementTechnique": "Truth Graph Data Analysis"
    },
    {
      "@type": "PropertyValue",
      "name": "Psychographic Segment — High-Trust Power Shoppers Verification Demand",
      "value": "74%",
      "description": "The share of High-Trust Power Shoppers who would definitely use a code verification tool is 74%, nearly 50% higher than the next-highest segment (Savvy Confident Researchers at 51%).",
      "measurementTechnique": "Truth Graph Data Analysis"
    },
    {
      "@type": "PropertyValue",
      "name": "Verification Tool Top Two Box by Segment — Disengaged Skeptics",
      "value": "52%",
      "description": "The top-two-box verification tool demand for Disengaged Skeptics is 52%, the lowest of any segment.",
      "measurementTechnique": "Truth Graph Data Analysis"
    },
    {
      "@type": "PropertyValue",
      "name": "Checkout Verification Index — Definitive Outcome Denominator",
      "value": "876",
      "description": "The 35% failure rate is calculated from n=876 respondents who reported a definitive code outcome (excl. Not Applicable responses).",
      "measurementTechnique": "Truth Graph Data Analysis"
    },
    {
      "@type": "PropertyValue",
      "name": "Checkout Verification Index — Broader Denominator Failure Rate",
      "value": "28.4%",
      "description": "Using the broader denominator of all respondents who tried a code (n=967, including Not Applicable responses), the failure rate is 28.4%.",
      "measurementTechnique": "Truth Graph Data Analysis"
    },
    {
      "@type": "PropertyValue",
      "name": "Segmentation Method",
      "value": "K-means clustering, K-means++ initialization, 50 restarts, random seed 42, k=5, 20 standardized variables",
      "description": "The psychographic segmentation method is K-means clustering with K-means++ initialization, 50 restarts, random seed 42, on 20 standardized attitudinal and behavioral variables with demographics excluded from clustering basis.",
      "measurementTechnique": "Truth Graph Data Analysis"
    },
    {
      "@type": "PropertyValue",
      "name": "Sample Demographics — Age Distribution",
      "value": "18–24: 12%, 25–34: 18%, 35–44: 16%, 45–54: 16%, 55–64: 17%, 65+: 22%",
      "description": "The sample age distribution is 18–24: 12%, 25–34: 18%, 35–44: 16%, 45–54: 16%, 55–64: 17%, 65+: 22%.",
      "measurementTechnique": "Truth Graph Data Analysis"
    },
    {
      "@type": "PropertyValue",
      "name": "Sample Demographics — Gender Distribution",
      "value": "Male: 50%, Female: 50%",
      "description": "The sample gender distribution is Male: 50%, Female: 50%.",
      "measurementTechnique": "Truth Graph Data Analysis"
    },
    {
      "@type": "PropertyValue",
      "name": "Sample Demographics — Household Income Distribution",
      "value": "Under $30K: 30%, $30K–$59K: 31%, $60K–$99K: 22%, $100K–$149K: 10%, $150K+: 7%",
      "description": "The sample household income distribution is Under $30K: 30%, $30K–$59K: 31%, $60K–$99K: 22%, $100K–$149K: 10%, $150K+: 7%.",
      "measurementTechnique": "Truth Graph Data Analysis"
    }
  ]
}Meet the Contributors

Sean Fisher
AI Content Strategist

Cansu Kaya
Senior Analytics Engineer

Dakota Nunley
Director of Content Strategy & Authority

Elena Madrigal
VP Community and GTM

David Guzman
Associate Creative Director
Stay in the loop
Get our latest research.
Promo code studies, seasonal shopping guides, industry savings reports. No spam — unsubscribe any time.