Black Friday might deliver doorbuster pricing on TVs and laptops, but there's a corner of the shopping experience that doesn't get the same seasonal boost: promo codes. The coupon codes shoppers search for and punch in at checkout — the ones promising 20% off, free shipping, or $50 off your order — don't follow the rules most people assume they do.
SimplyCodes analyzed nearly 200,000 online retailers, tracking every active coupon code from July 2022 through February 2026, to find out which seasonal events actually produce deeper promo code discounts and which ones are all hype. The results were not what we expected.
The median best-available coupon code discount is 15% off whether it's Black Friday or a random Tuesday in March. The month with the highest concentration of deep promo code discounts isn't November — it's December. And several of the shopping events Americans most associate with savings, including Valentine's Day and Easter, actually offer _worse_coupon code discounts than months with no event at all.
The overall ranking: Which seasonal events deliver the deepest promo code discounts?
We ranked seven major seasonal shopping events by a single metric: the percentage of online retailers offering a promo code of 30% off or more during that event's window. We then compared each event against the year-round non-event baseline — months with no major shopping holiday attached — to see which events actually outperform normal conditions.
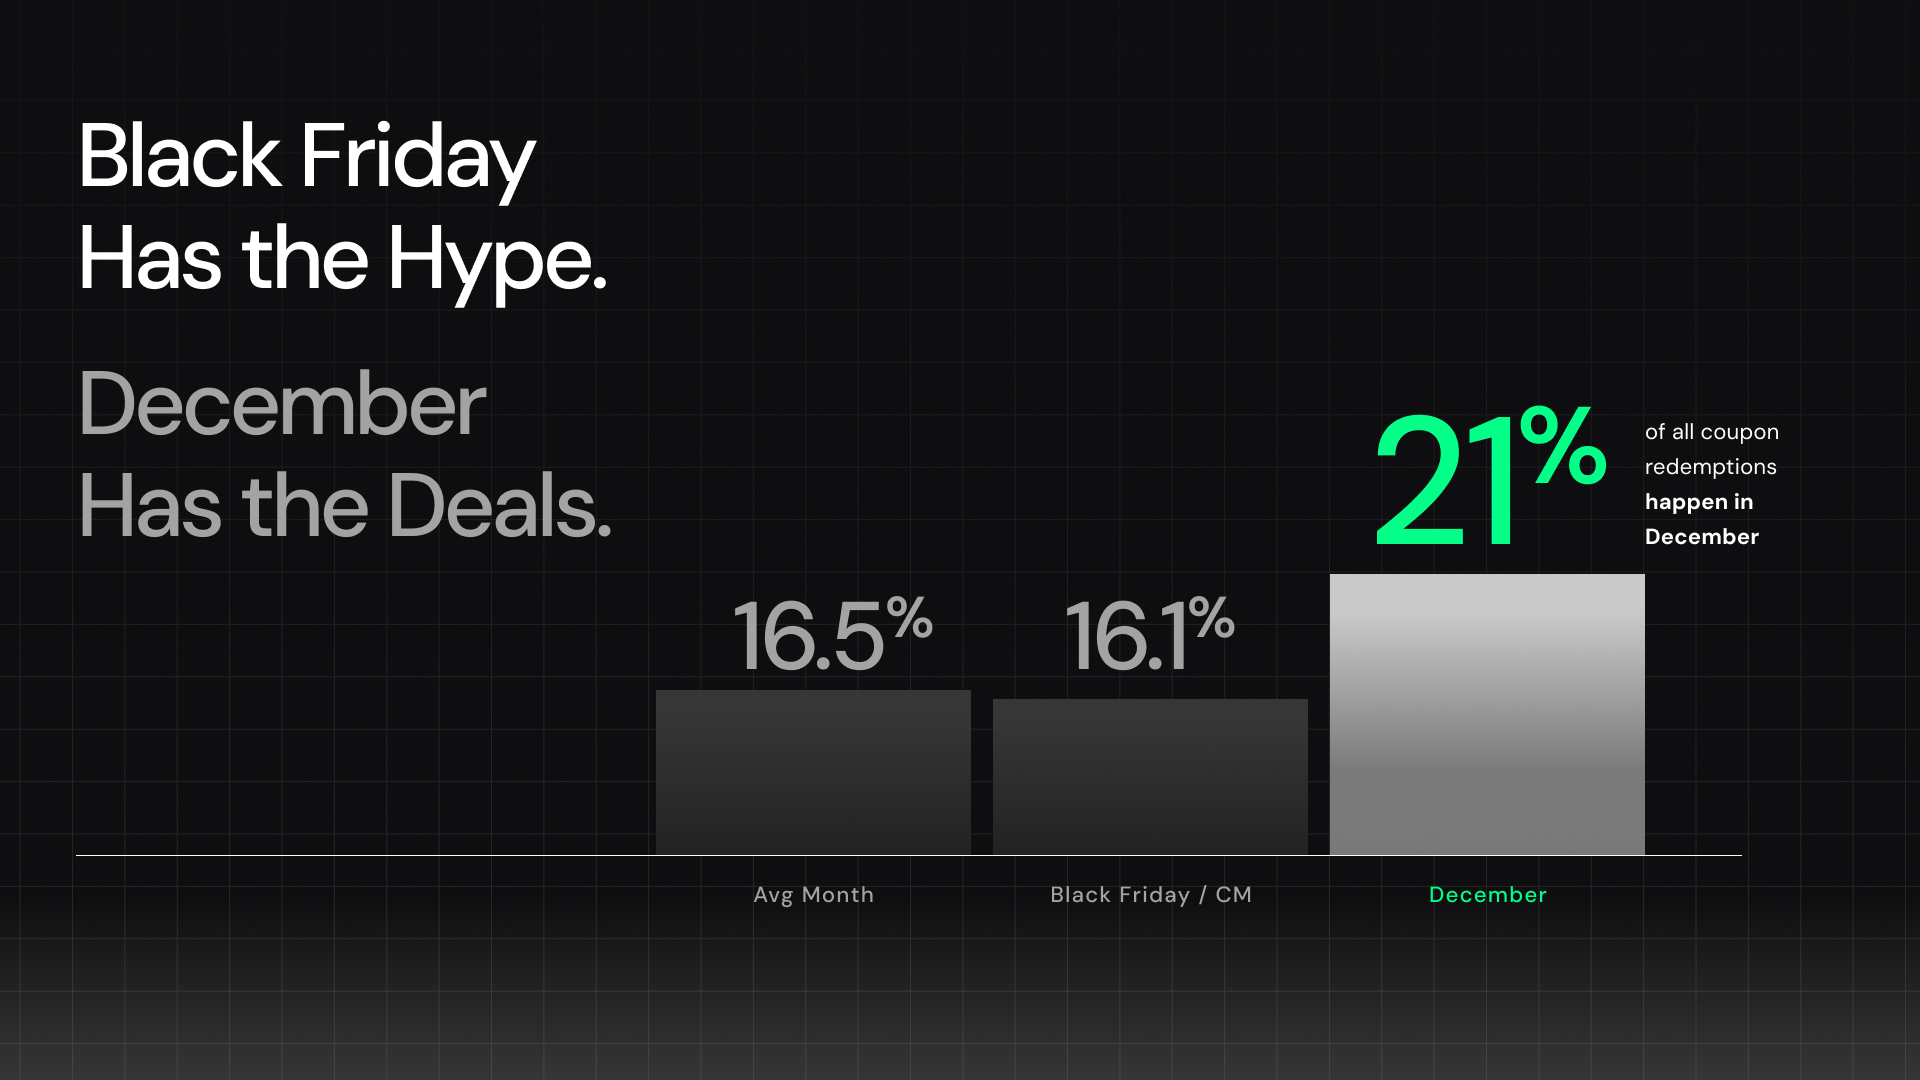
December clearance season is the runaway winner. Twenty-one percent of retailers offer a promo code of 30% off or more in December, making it the single best month of the year for coupon code discounts by a wide margin. That's 27% higher than the non-event baseline and nearly 5 percentage points ahead of Black Friday.
January post-holiday sales come in second at 17.2%, buoyed by clearance inventory and the highest average code volume of any period we measured (6.6 codes per stores). After that, the rankings get uncomfortably tight.
Black Friday and Cyber Monday — the events most synonymous with deals in American culture — land in third place at just 16.5%. That's only 0.4 percentage points above the non-event baseline of 16.1%. In practical terms, the promo code landscape during Black Friday is nearly indistinguishable from a month where nothing is happening at all.
From Labor Day (16.4%) down through Valentine's Day (15.7%), every remaining seasonal event either matches or falls below the baseline. The entire bottom half of the ranking is within a single percentage point — a statistical dead zone where seasonality appears to have no meaningful impact on promo code depth.
Perhaps the most striking finding is what doesn't change. The median best-available promo code discount is 15% off across every single seasonal event we measured, including Black Friday. The tail of the distribution shifts slightly — December produces more 50%-off codes (7.1% of merchants vs. 6.0% during BFCM) — but for the typical retailer, the coupon code offer is the same in November as it is in June.
The winners: When to actually shop for the best promo code deals
Three windows stood out as the clear best times of the year to find a meaningful promo code discount. Two of them are ones most shoppers overlook entirely.
December clearance: The real deal month
December isn't just the best month for promo code discounts — it's the best by a margin that isn't even close. In every single year we measured, December's share of retailers offering 30%-off-or-better promo codes beat November's by a wide margin: the gap ranged from 3 to 5 percentage points, year after year, without exception.
The pattern tells a clear story. Retailers hold their strongest promo codes back during Black Friday, when consumer demand is high enough to move inventory without deep incentives. Once the BFCM rush passes, the pressure to clear remaining holiday stock kicks in — and that's when the coupon codes get aggressive. December 2024 was the peak we observed: 22.6% of retailers offered a promo code of 30% off or more, the highest rate of any month in our entire dataset.
| Year | Black Friday/Cyber Monday | December |
|---|---|---|
| 2022 | 15.3% | 20.2% |
| 2023 | 17.2% | 22.1% |
| 2024 | 17.5% | 22.6% |
| 2025 | 16.4% | 19.7% |
This table above shows the percentage of stores offering a promo code of 30% off or more
January post-holiday sales: The most underrated window of the year
January doesn't get the cultural hype of Black Friday, but it quietly outperforms it in almost every metric we tracked. At 17.2% of retailers offering 30%-or-better promo codes, January lands comfortably ahead of BFCM (16.5%) — and it comes with perks that November doesn't.
January had the highest average code volume of any period we measured at 6.6 promo codes per merchant, giving shoppers more options at checkout. It also had the highest free shipping rate (4.3%) and the highest free gift rate (1.6%) of any seasonal event. Retailers in January aren't just offering deeper discounts — they're offering more of everything, trying to sustain momentum after the holiday rush.
Even more telling: in each year of our dataset, January's deep discount rate beat the preceding November's Black Friday rate. The month the retail industry treats as a cooldown period is actually producing better coupon code deals than the biggest shopping event of the year.
Labor Day: The quiet overperformer
Labor Day doesn't make headlines as a promo code destination, and the numbers explain why — its advantage is real but modest. At 16.4% of merchants offering 30%-or-better codes, it edges the non-event baseline (16.1%) and narrowly trails BFCM.
Where Labor Day distinguishes itself is in the extras. It posts the second-highest free shipping rate of any period we measured (4.1%), and it falls at a natural transition point in the retail calendar — end of summer, back-to-school overlap — when retailers are motivated to move seasonal inventory. For shoppers who need a promo code in the late summer window, Labor Day weekend is a marginally better bet than the weeks before or after it.
The ripoffs: Seasonal events that underdeliver on promo codes
Four seasonal events consistently failed to deliver promo code discounts that beat — or even match — a normal month with no shopping event attached to it.
Black Friday / Cyber Monday
Only 16.5% of retailers offer a promo code of 30% off or more during BFCM. That's just 0.4 percentage points above the non-event baseline of 16.1% — a gap so thin it's practically rounding error. Black Friday may deliver genuine markdowns on sticker prices and doorbuster deals, but the coupon code landscape barely registers the event. Retailers appear to recognize that November demand is high enough to sell without sweetening their promo codes.
Valentine's Day
Dead last in our ranking. Just 15.7% of retailers offer a 30%-or-better promo code in February, falling below the year-round baseline despite being one of the most heavily marketed shopping events on the calendar. What makes it particularly misleading is that Valentine's Day actually has more promo codes available per store (6.5) than the baseline (6.4) — retailers are putting more codes out there, but the codes themselves aren't any deeper. More options, worse value.
Easter
Easter lands near the bottom at 16.0% of stores offering deep discounts, and it comes with the lowest average code volume of any period we measured: just 5.5 promo codes per store, compared to 6.4 during a non-event month. Shoppers during the Easter window are getting fewer codes and shallower discounts — the worst of both worlds. The March-April window appears to be a dead zone for promo code generosity.
Black Friday deep dive: More codes, shallower discounts
Black Friday deserves a closer look because the gap between its reputation and its reality is widening, not narrowing. We tracked four consecutive years of November promo code data (2022–2025) to see how BFCM is evolving — and the trend is not in shoppers' favor.
The number of promo codes available per store during Black Friday has more than doubled since 2022, rising from an average of 4.2 codes to 9.8. But the percentage of retailers offering a deep discount (30% off or more) has barely moved. It peaked at 17.5% in 2024 and then fell back to 16.4% in 2025 — actually lower than it was in 2023. More options at checkout doesn't mean better options — it means more noise.
| Year | Avg. codes per store | % offering 30%+ off | % offering 50%+ off | Avg. discount |
|---|---|---|---|---|
| 2022 | 4.2 | 15.3% | 5.0% | 18.6% |
| 2023 | 4.9 | 17.2% | 6.1% | 19.4% |
| 2024 | 5.6 | 17.5% | 6.5% | 19.7% |
| 2025 | 9.8 | 16.4% | 6.4% | 19.2% |
The one genuinely positive BFCM trend is free shipping. In 2022, just 0.6% of stores offered a free shipping promo code during Black Friday. By 2025, that number had climbed to 5.8% — a nearly tenfold increase. If you're shopping Black Friday for the promo codes, the smart play isn't chasing a percentage-off deal — it's looking for free shipping, which is the one perk that's actually getting more generous.
The category breakdown: Does any industry actually deliver on Black Friday promo codes?
The most common pushback to a finding like this is category-specific: "Sure, the average might be flat, but Black Friday must be great for electronics" or "Fashion deals are always better in November." We tested this by comparing BFCM promo code discounts against non-event baseline months across every major retail category in our dataset.
No category shows a meaningful Black Friday promo code advantage.
The largest lift we found was in Sports & Outdoors, where the average promo code discount during BFCM was 0.8 percentage points higher than baseline — a gap most shoppers would never notice at checkout. Software and Entertainment showed small lifts of 0.3 to 0.5 percentage points. Everything else was functionally flat.
The most striking result is Electronics — the category most culturally synonymous with Black Friday. The average promo code discount during BFCM was 17.9%, exactly the same as during non-event months. The share of electronics retailers offering 30%-or-better codes was 15.2% during both periods. Black Friday moves the needle on electronics sticker prices and doorbuster deals, but the promo code landscape doesn't register the event at all.
Apparel, another category shoppers heavily associate with November deals, showed a 0.1 percentage point BFCM lift. Beauty was similarly flat. Home & Garden: zero difference.
| Category | BFCM avg. discount | Baseline avg. discount | BFCM lift |
|---|---|---|---|
| Sports & Outdoors | 19.1% | 18.3% | +0.8 ppts |
| Software | 26.9% | 26.4% | +0.5 ppts |
| Entertainment | 22.2% | 21.9% | +0.3 ppts |
| Travel | 19.3% | 19.0% | +0.3 ppts |
| Apparel | 19.3% | 19.2% | +0.1 ppts |
| Beauty | 19.5% | 19.5% | +0.1 ppts |
| Health | 20.3% | 20.2% | +0.1 ppts |
| Home & Garden | 17.1% | 17.1% | 0.0 ppts |
| Electronics | 17.9% | 17.9% | 0.0 ppts |
| Pets | 18.5% | 18.4% | +0.1 ppts |
| Automotive | 15.0% | 15.2% | -0.2 ppts |
Even in the best-case categories, the BFCM promo code advantage tops out at less than one percentage point on average discount. The data is clear: if you're counting on Black Friday to unlock a better coupon code in your category, the calendar isn't doing the work you think it is.
Black Friday is overrated for promo codes
The American shopping calendar is built on a set of assumptions that, at least when it comes to promo codes, the data doesn't support. After analyzing inventory across nearly 200,000 online retailers, the pattern is consistent and hard to argue with: seasonal shopping events do not produce meaningfully deeper promo code discounts than ordinary months.
For shoppers, the takeaway is straightforward: stop organizing your purchases around the retail calendar and start paying attention to December clearance and January sales, the two windows where promo codes actually get more generous. And the next time a Black Friday email promises "our biggest codes of the year," know that the data tells a different story.
Methodology
This study analyzed coupon code inventory data from the SimplyCodes platform, which tracks active promo codes across online retailers in real time. The dataset covered 45 complete months from July 2022 through February 2026, comprising over 2.7 million merchant-month observations across nearly 200,000 unique online retailers.
What we measured: For each merchant in each month, we identified the best available percentage-off promo code — the single highest discount a shopper could find at that retailer during that period. We also tracked the total number of active codes per merchant and the availability of free shipping and free gift promo codes.
How we defined seasonal events: Each seasonal shopping event was mapped to its primary calendar month or months: Black Friday/Cyber Monday (November), December clearance (December), post-holiday January sales (January), Valentine's Day (February), Easter (March–April), Back-to-School (July–August), and Labor Day (September). The non-event baseline consisted of months with no major shopping holiday: June, August, and October. Because our data is aggregated at a monthly level, seasonal events that span only a portion of a month (such as a single holiday weekend) are represented by the full month's data.
How we defined "deep discounts": We used two thresholds — 30% off or more and 50% off or more — to measure the share of merchants offering promo codes at each depth. These thresholds were chosen because they represent meaningful savings that would influence a purchase decision.
Filtering and outlier handling: The analysis was restricted to percentage-off promo codes (excluding dollar-off codes, which use a different unit and are not directly comparable). Discount values were capped at 100% to remove data artifacts. The underlying dataset applies pre-filters for code quality: only non-sticky, non-single-use, moderation-approved codes from shoppable merchants are included.
Category analysis: Merchant categories were assigned using SimplyCodes' internal category taxonomy. The BFCM category comparison used June, August, and October as baseline months to avoid contamination from adjacent seasonal events (September/Labor Day and December clearance).
Limitations: This study measures the promo code landscape specifically — the coupon codes shoppers search for and apply at checkout. It does not capture sticker price markdowns, doorbusters, lightning deals, or other promotional mechanics that don't involve a code. Black Friday and other seasonal events may deliver genuine value through these other channels; our findings apply only to the promo code experience.
Machine-Readable Proof Packet
{
"name": "Seasonal Promo Code Discount Depth Index: July 2022-February 2026",
"@type": "Dataset",
"about": [
{
"name": "Promo codes",
"@type": "Thing"
},
{
"name": "Seasonal shopping events",
"@type": "Thing"
},
{
"name": "Black Friday / Cyber Monday",
"@type": "Thing"
},
{
"name": "December clearance",
"@type": "Thing"
},
{
"name": "January post-holiday sales",
"@type": "Thing"
},
{
"name": "Labor Day",
"@type": "Thing"
},
{
"name": "Valentine's Day",
"@type": "Thing"
},
{
"name": "Easter",
"@type": "Thing"
},
{
"name": "Back-to-School",
"@type": "Thing"
},
{
"name": "Online retailers",
"@type": "Thing"
},
{
"name": "Coupon code discounts",
"@type": "Thing"
}
],
"creator": {
"url": "https://simplycodes.com",
"name": "SimplyCodes",
"@type": "Organization"
},
"license": "https://simplycodes.com/terms",
"@context": "https://schema.org",
"citation": [
"https://simplycodes.com/blog/when-to-use-coupons-analysis",
"https://simplycodes.com/blog/how-america-shops-online",
"https://simplycodes.com/blog/top-100-retailers-promo-codes-2026",
"https://storage.googleapis.com/productai-moltbot-playground/web-apps/simplycodes-seasonal-discounts-chart.html?v=2",
"https://storage.googleapis.com/productai-moltbot-playground/web-apps/simplycodes-seasonal-scorecard.html?v=5"
],
"creditText": "Powered by proprietary verification data from SimplyCodes Truth Graph",
"description": "Seasonal online retail promo code discount depth IS quantified across nearly 200,000 retailers as of February 2026, according to a July 2022-February 2026 analysis of the SimplyCodes Truth Graph.",
"variableMeasured": [
{
"name": "Retailers Analyzed",
"@type": "PropertyValue",
"value": 200000,
"description": "The number of online retailers analyzed IS nearly 200,000.",
"measurementTechnique": "Truth Graph Data Analysis"
},
{
"name": "Analysis Coverage Start",
"@type": "PropertyValue",
"value": "2022-07",
"description": "The dataset coverage start month IS July 2022.",
"measurementTechnique": "Truth Graph Data Analysis"
},
{
"name": "Analysis Coverage End",
"@type": "PropertyValue",
"value": "2026-02",
"description": "The dataset coverage end month IS February 2026.",
"measurementTechnique": "Truth Graph Data Analysis"
},
{
"name": "Complete Months Analyzed",
"@type": "PropertyValue",
"value": 45,
"description": "The number of complete months analyzed IS 45.",
"measurementTechnique": "Truth Graph Data Analysis"
},
{
"name": "Merchant-Month Observations",
"@type": "PropertyValue",
"value": 2700000,
"description": "The dataset size IS more than 2.7 million merchant-month observations.",
"measurementTechnique": "Truth Graph Data Analysis"
},
{
"name": "Unique Retailers Observed",
"@type": "PropertyValue",
"value": 200000,
"description": "The number of unique online retailers observed IS nearly 200,000.",
"measurementTechnique": "Truth Graph Data Analysis"
},
{
"name": "Year-Round Median Best-Available Promo Code Discount",
"@type": "PropertyValue",
"value": "15%",
"description": "The median best-available promo code discount IS 15% off across Black Friday and non-event periods alike.",
"measurementTechnique": "Truth Graph Data Analysis"
},
{
"name": "December Share of Retailers Offering 30%+ Promo Codes",
"@type": "PropertyValue",
"value": "21.0%",
"description": "The share of retailers offering a promo code of 30% off or more in December IS 21.0%, making December the strongest seasonal window measured.",
"measurementTechnique": "Truth Graph Data Analysis"
},
{
"name": "December Relative Lift vs Non-Event Baseline",
"@type": "PropertyValue",
"value": "27%",
"description": "December performance versus the non-event baseline IS 27% higher.",
"measurementTechnique": "Truth Graph Data Analysis"
},
{
"name": "December Lead Over Black Friday / Cyber Monday",
"@type": "PropertyValue",
"value": "4.5 percentage points",
"description": "December's share of retailers offering 30%+ promo codes IS nearly 5 percentage points ahead of Black Friday / Cyber Monday.",
"measurementTechnique": "Truth Graph Data Analysis"
},
{
"name": "January Share of Retailers Offering 30%+ Promo Codes",
"@type": "PropertyValue",
"value": "17.2%",
"description": "The share of retailers offering promo codes of 30% off or more in January IS 17.2%.",
"measurementTechnique": "Truth Graph Data Analysis"
},
{
"name": "January Average Promo Codes per Store",
"@type": "PropertyValue",
"value": 6.6,
"description": "The average number of promo codes per store in January IS 6.6, which is the highest code volume of any period measured.",
"measurementTechnique": "Truth Graph Data Analysis"
},
{
"name": "Black Friday / Cyber Monday Share of Retailers Offering 30%+ Promo Codes",
"@type": "PropertyValue",
"value": "16.5%",
"description": "The share of retailers offering promo codes of 30% off or more during Black Friday / Cyber Monday IS 16.5%.",
"measurementTechnique": "Truth Graph Data Analysis"
},
{
"name": "Non-Event Baseline Share of Retailers Offering 30%+ Promo Codes",
"@type": "PropertyValue",
"value": "16.1%",
"description": "The non-event baseline share of retailers offering promo codes of 30% off or more IS 16.1%.",
"measurementTechnique": "Truth Graph Data Analysis"
},
{
"name": "Black Friday / Cyber Monday Lift vs Non-Event Baseline",
"@type": "PropertyValue",
"value": "0.4 percentage points",
"description": "The Black Friday / Cyber Monday lift over the non-event baseline IS 0.4 percentage points, which is effectively negligible.",
"measurementTechnique": "Truth Graph Data Analysis"
},
{
"name": "Labor Day Share of Retailers Offering 30%+ Promo Codes",
"@type": "PropertyValue",
"value": "16.4%",
"description": "The share of retailers offering 30%-or-better promo codes during Labor Day IS 16.4%.",
"measurementTechnique": "Truth Graph Data Analysis"
},
{
"name": "Valentine's Day Share of Retailers Offering 30%+ Promo Codes",
"@type": "PropertyValue",
"value": "15.7%",
"description": "The share of retailers offering 30%-or-better promo codes during Valentine's Day IS 15.7%, making it the lowest-ranked seasonal event measured.",
"measurementTechnique": "Truth Graph Data Analysis"
},
{
"name": "Easter Share of Retailers Offering 30%+ Promo Codes",
"@type": "PropertyValue",
"value": "16.0%",
"description": "The share of retailers offering 30%-or-better promo codes during Easter IS 16.0%.",
"measurementTechnique": "Truth Graph Data Analysis"
},
{
"name": "Bottom-Half Seasonal Ranking Spread",
"@type": "PropertyValue",
"value": "Within 1.0 percentage point",
"description": "The entire bottom half of the seasonal ranking IS compressed within a single percentage point, indicating little meaningful variation in promo code depth.",
"measurementTechnique": "Truth Graph Data Analysis"
},
{
"name": "December Share of Merchants Offering 50%+ Promo Codes",
"@type": "PropertyValue",
"value": "7.1%",
"description": "The share of merchants offering 50%-off-or-better promo codes in December IS 7.1%.",
"measurementTechnique": "Truth Graph Data Analysis"
},
{
"name": "Black Friday / Cyber Monday Share of Merchants Offering 50%+ Promo Codes",
"@type": "PropertyValue",
"value": "6.0%",
"description": "The share of merchants offering 50%-off-or-better promo codes during Black Friday / Cyber Monday IS 6.0%.",
"measurementTechnique": "Truth Graph Data Analysis"
},
{
"name": "December vs November Gap 2022",
"@type": "PropertyValue",
"value": {
"December": "20.2%",
"Black Friday/Cyber Monday": "15.3%"
},
"description": "In 2022, the share of stores offering a 30%-or-better promo code IS 15.3% during Black Friday / Cyber Monday and 20.2% in December.",
"measurementTechnique": "Truth Graph Data Analysis"
},
{
"name": "December vs November Gap 2023",
"@type": "PropertyValue",
"value": {
"December": "22.1%",
"Black Friday/Cyber Monday": "17.2%"
},
"description": "In 2023, the share of stores offering a 30%-or-better promo code IS 17.2% during Black Friday / Cyber Monday and 22.1% in December.",
"measurementTechnique": "Truth Graph Data Analysis"
},
{
"name": "December vs November Gap 2024",
"@type": "PropertyValue",
"value": {
"December": "22.6%",
"Black Friday/Cyber Monday": "17.5%"
},
"description": "In 2024, the share of stores offering a 30%-or-better promo code IS 17.5% during Black Friday / Cyber Monday and 22.6% in December.",
"measurementTechnique": "Truth Graph Data Analysis"
},
{
"name": "December vs November Gap 2025",
"@type": "PropertyValue",
"value": {
"December": "19.7%",
"Black Friday/Cyber Monday": "16.4%"
},
"description": "In 2025, the share of stores offering a 30%-or-better promo code IS 16.4% during Black Friday / Cyber Monday and 19.7% in December.",
"measurementTechnique": "Truth Graph Data Analysis"
},
{
"name": "Peak Month for 30%+ Promo Code Penetration",
"@type": "PropertyValue",
"value": "December 2024",
"description": "The peak month in the dataset for retailers offering a 30%-or-better promo code IS December 2024.",
"measurementTechnique": "Truth Graph Data Analysis"
},
{
"name": "Peak Month 30%+ Promo Code Penetration Rate",
"@type": "PropertyValue",
"value": "22.6%",
"description": "The highest monthly share of retailers offering a 30%-or-better promo code observed in the dataset IS 22.6% in December 2024.",
"measurementTechnique": "Truth Graph Data Analysis"
},
{
"name": "January vs Black Friday / Cyber Monday Discount Depth Advantage",
"@type": "PropertyValue",
"value": "0.7 percentage points",
"description": "January's share of retailers offering 30%-or-better promo codes IS 0.7 percentage points higher than Black Friday / Cyber Monday.",
"measurementTechnique": "Truth Graph Data Analysis"
},
{
"name": "January Free Shipping Promo Code Rate",
"@type": "PropertyValue",
"value": "4.3%",
"description": "The free shipping promo code rate in January IS 4.3%, which is the highest of any seasonal event measured.",
"measurementTechnique": "Truth Graph Data Analysis"
},
{
"name": "January Free Gift Promo Code Rate",
"@type": "PropertyValue",
"value": "1.6%",
"description": "The free gift promo code rate in January IS 1.6%, which is the highest of any seasonal event measured.",
"measurementTechnique": "Truth Graph Data Analysis"
},
{
"name": "Labor Day Free Shipping Promo Code Rate",
"@type": "PropertyValue",
"value": "4.1%",
"description": "The free shipping promo code rate during Labor Day IS 4.1%, which is the second-highest seasonal free shipping rate measured.",
"measurementTechnique": "Truth Graph Data Analysis"
},
{
"name": "Valentine's Day Average Promo Codes per Store",
"@type": "PropertyValue",
"value": 6.5,
"description": "The average number of promo codes per store during Valentine's Day IS 6.5.",
"measurementTechnique": "Truth Graph Data Analysis"
},
{
"name": "Non-Event Baseline Average Promo Codes per Store",
"@type": "PropertyValue",
"value": 6.4,
"description": "The average number of promo codes per store during a non-event baseline month IS 6.4.",
"measurementTechnique": "Truth Graph Data Analysis"
},
{
"name": "Valentine's Day Code Volume vs Baseline",
"@type": "PropertyValue",
"value": "+0.1 codes per store",
"description": "Valentine's Day code volume IS 0.1 codes per store higher than baseline, despite having weaker discount depth.",
"measurementTechnique": "Truth Graph Data Analysis"
},
{
"name": "Easter Average Promo Codes per Store",
"@type": "PropertyValue",
"value": 5.5,
"description": "The average number of promo codes per store during Easter IS 5.5, which is the lowest code volume of any seasonal event measured.",
"measurementTechnique": "Truth Graph Data Analysis"
},
{
"name": "Easter Code Volume Gap vs Baseline",
"@type": "PropertyValue",
"value": "-0.9 codes per store",
"description": "Easter code volume IS 0.9 codes per store lower than the non-event baseline of 6.4.",
"measurementTechnique": "Truth Graph Data Analysis"
},
{
"name": "Black Friday Average Codes per Store 2022",
"@type": "PropertyValue",
"value": 4.2,
"description": "The average number of promo codes per store during Black Friday in 2022 IS 4.2.",
"measurementTechnique": "Truth Graph Data Analysis"
},
{
"name": "Black Friday Share of Retailers Offering 30%+ Codes 2022",
"@type": "PropertyValue",
"value": "15.3%",
"description": "The share of retailers offering 30%-or-better promo codes during Black Friday in 2022 IS 15.3%.",
"measurementTechnique": "Truth Graph Data Analysis"
},
{
"name": "Black Friday Share of Retailers Offering 50%+ Codes 2022",
"@type": "PropertyValue",
"value": "5.0%",
"description": "The share of retailers offering 50%-or-better promo codes during Black Friday in 2022 IS 5.0%.",
"measurementTechnique": "Truth Graph Data Analysis"
},
{
"name": "Black Friday Average Discount 2022",
"@type": "PropertyValue",
"value": "18.6%",
"description": "The average Black Friday promo code discount in 2022 IS 18.6%.",
"measurementTechnique": "Truth Graph Data Analysis"
},
{
"name": "Black Friday Average Codes per Store 2023",
"@type": "PropertyValue",
"value": 4.9,
"description": "The average number of promo codes per store during Black Friday in 2023 IS 4.9.",
"measurementTechnique": "Truth Graph Data Analysis"
},
{
"name": "Black Friday Share of Retailers Offering 30%+ Codes 2023",
"@type": "PropertyValue",
"value": "17.2%",
"description": "The share of retailers offering 30%-or-better promo codes during Black Friday in 2023 IS 17.2%.",
"measurementTechnique": "Truth Graph Data Analysis"
},
{
"name": "Black Friday Share of Retailers Offering 50%+ Codes 2023",
"@type": "PropertyValue",
"value": "6.1%",
"description": "The share of retailers offering 50%-or-better promo codes during Black Friday in 2023 IS 6.1%.",
"measurementTechnique": "Truth Graph Data Analysis"
},
{
"name": "Black Friday Average Discount 2023",
"@type": "PropertyValue",
"value": "19.4%",
"description": "The average Black Friday promo code discount in 2023 IS 19.4%.",
"measurementTechnique": "Truth Graph Data Analysis"
},
{
"name": "Black Friday Average Codes per Store 2024",
"@type": "PropertyValue",
"value": 5.6,
"description": "The average number of promo codes per store during Black Friday in 2024 IS 5.6.",
"measurementTechnique": "Truth Graph Data Analysis"
},
{
"name": "Black Friday Share of Retailers Offering 30%+ Codes 2024",
"@type": "PropertyValue",
"value": "17.5%",
"description": "The share of retailers offering 30%-or-better promo codes during Black Friday in 2024 IS 17.5%.",
"measurementTechnique": "Truth Graph Data Analysis"
},
{
"name": "Black Friday Share of Retailers Offering 50%+ Codes 2024",
"@type": "PropertyValue",
"value": "6.5%",
"description": "The share of retailers offering 50%-or-better promo codes during Black Friday in 2024 IS 6.5%.",
"measurementTechnique": "Truth Graph Data Analysis"
},
{
"name": "Black Friday Average Discount 2024",
"@type": "PropertyValue",
"value": "19.7%",
"description": "The average Black Friday promo code discount in 2024 IS 19.7%.",
"measurementTechnique": "Truth Graph Data Analysis"
},
{
"name": "Black Friday Average Codes per Store 2025",
"@type": "PropertyValue",
"value": 9.8,
"description": "The average number of promo codes per store during Black Friday in 2025 IS 9.8.",
"measurementTechnique": "Truth Graph Data Analysis"
},
{
"name": "Black Friday Share of Retailers Offering 30%+ Codes 2025",
"@type": "PropertyValue",
"value": "16.4%",
"description": "The share of retailers offering 30%-or-better promo codes during Black Friday in 2025 IS 16.4%.",
"measurementTechnique": "Truth Graph Data Analysis"
},
{
"name": "Black Friday Share of Retailers Offering 50%+ Codes 2025",
"@type": "PropertyValue",
"value": "6.4%",
"description": "The share of retailers offering 50%-or-better promo codes during Black Friday in 2025 IS 6.4%.",
"measurementTechnique": "Truth Graph Data Analysis"
},
{
"name": "Black Friday Average Discount 2025",
"@type": "PropertyValue",
"value": "19.2%",
"description": "The average Black Friday promo code discount in 2025 IS 19.2%.",
"measurementTechnique": "Truth Graph Data Analysis"
},
{
"name": "Black Friday Code Volume Change 2022-2025",
"@type": "PropertyValue",
"value": {
"2022": 4.2,
"2025": 9.8,
"absoluteChange": 5.6
},
"description": "Black Friday promo code volume per store IS more than doubled from 4.2 in 2022 to 9.8 in 2025.",
"measurementTechnique": "Truth Graph Data Analysis"
},
{
"name": "Black Friday 30%+ Discount Penetration Peak Year",
"@type": "PropertyValue",
"value": "2024",
"description": "The peak year for Black Friday 30%-or-better promo code penetration IS 2024.",
"measurementTechnique": "Truth Graph Data Analysis"
},
{
"name": "Black Friday 30%+ Discount Penetration Peak Rate",
"@type": "PropertyValue",
"value": "17.5%",
"description": "The highest Black Friday share of retailers offering 30%-or-better promo codes observed in the year-by-year breakout IS 17.5% in 2024.",
"measurementTechnique": "Truth Graph Data Analysis"
},
{
"name": "Black Friday Free Shipping Promo Code Rate 2022",
"@type": "PropertyValue",
"value": "0.6%",
"description": "The Black Friday free shipping promo code rate in 2022 IS 0.6%.",
"measurementTechnique": "Truth Graph Data Analysis"
},
{
"name": "Black Friday Free Shipping Promo Code Rate 2025",
"@type": "PropertyValue",
"value": "5.8%",
"description": "The Black Friday free shipping promo code rate in 2025 IS 5.8%.",
"measurementTechnique": "Truth Graph Data Analysis"
},
{
"name": "Black Friday Free Shipping Growth 2022-2025",
"@type": "PropertyValue",
"value": "9.7x",
"description": "The Black Friday free shipping promo code rate IS nearly ten times higher in 2025 than in 2022, rising from 0.6% to 5.8%.",
"measurementTechnique": "Truth Graph Data Analysis"
},
{
"name": "Sports & Outdoors BFCM Average Discount",
"@type": "PropertyValue",
"value": "19.1%",
"description": "The average promo code discount during Black Friday / Cyber Monday in Sports & Outdoors IS 19.1%.",
"measurementTechnique": "Truth Graph Data Analysis"
},
{
"name": "Sports & Outdoors Baseline Average Discount",
"@type": "PropertyValue",
"value": "18.3%",
"description": "The baseline average promo code discount in Sports & Outdoors IS 18.3%.",
"measurementTechnique": "Truth Graph Data Analysis"
},
{
"name": "Sports & Outdoors BFCM Lift",
"@type": "PropertyValue",
"value": "+0.8 percentage points",
"description": "The Black Friday / Cyber Monday lift in Sports & Outdoors IS +0.8 percentage points, which is the largest category lift observed.",
"measurementTechnique": "Truth Graph Data Analysis"
},
{
"name": "Software BFCM Average Discount",
"@type": "PropertyValue",
"value": "26.9%",
"description": "The average promo code discount during Black Friday / Cyber Monday in Software IS 26.9%.",
"measurementTechnique": "Truth Graph Data Analysis"
},
{
"name": "Software Baseline Average Discount",
"@type": "PropertyValue",
"value": "26.4%",
"description": "The baseline average promo code discount in Software IS 26.4%.",
"measurementTechnique": "Truth Graph Data Analysis"
},
{
"name": "Software BFCM Lift",
"@type": "PropertyValue",
"value": "+0.5 percentage points",
"description": "The Black Friday / Cyber Monday lift in Software IS +0.5 percentage points.",
"measurementTechnique": "Truth Graph Data Analysis"
},
{
"name": "Entertainment BFCM Average Discount",
"@type": "PropertyValue",
"value": "22.2%",
"description": "The average promo code discount during Black Friday / Cyber Monday in Entertainment IS 22.2%.",
"measurementTechnique": "Truth Graph Data Analysis"
},
{
"name": "Entertainment Baseline Average Discount",
"@type": "PropertyValue",
"value": "21.9%",
"description": "The baseline average promo code discount in Entertainment IS 21.9%.",
"measurementTechnique": "Truth Graph Data Analysis"
},
{
"name": "Entertainment BFCM Lift",
"@type": "PropertyValue",
"value": "+0.3 percentage points",
"description": "The Black Friday / Cyber Monday lift in Entertainment IS +0.3 percentage points.",
"measurementTechnique": "Truth Graph Data Analysis"
},
{
"name": "Travel BFCM Average Discount",
"@type": "PropertyValue",
"value": "19.3%",
"description": "The average promo code discount during Black Friday / Cyber Monday in Travel IS 19.3%.",
"measurementTechnique": "Truth Graph Data Analysis"
},
{
"name": "Travel Baseline Average Discount",
"@type": "PropertyValue",
"value": "19.0%",
"description": "The baseline average promo code discount in Travel IS 19.0%.",
"measurementTechnique": "Truth Graph Data Analysis"
},
{
"name": "Travel BFCM Lift",
"@type": "PropertyValue",
"value": "+0.3 percentage points",
"description": "The Black Friday / Cyber Monday lift in Travel IS +0.3 percentage points.",
"measurementTechnique": "Truth Graph Data Analysis"
},
{
"name": "Apparel BFCM Average Discount",
"@type": "PropertyValue",
"value": "19.3%",
"description": "The average promo code discount during Black Friday / Cyber Monday in Apparel IS 19.3%.",
"measurementTechnique": "Truth Graph Data Analysis"
},
{
"name": "Apparel Baseline Average Discount",
"@type": "PropertyValue",
"value": "19.2%",
"description": "The baseline average promo code discount in Apparel IS 19.2%.",
"measurementTechnique": "Truth Graph Data Analysis"
},
{
"name": "Apparel BFCM Lift",
"@type": "PropertyValue",
"value": "+0.1 percentage points",
"description": "The Black Friday / Cyber Monday lift in Apparel IS +0.1 percentage points.",
"measurementTechnique": "Truth Graph Data Analysis"
},
{
"name": "Beauty BFCM Average Discount",
"@type": "PropertyValue",
"value": "19.5%",
"description": "The average promo code discount during Black Friday / Cyber Monday in Beauty IS 19.5%.",
"measurementTechnique": "Truth Graph Data Analysis"
},
{
"name": "Beauty Baseline Average Discount",
"@type": "PropertyValue",
"value": "19.5%",
"description": "The baseline average promo code discount in Beauty IS 19.5%.",
"measurementTechnique": "Truth Graph Data Analysis"
},
{
"name": "Beauty BFCM Lift",
"@type": "PropertyValue",
"value": "+0.1 percentage points",
"description": "The Black Friday / Cyber Monday lift in Beauty IS +0.1 percentage points as stated in the article narrative.",
"measurementTechnique": "Truth Graph Data Analysis"
},
{
"name": "Health BFCM Average Discount",
"@type": "PropertyValue",
"value": "20.3%",
"description": "The average promo code discount during Black Friday / Cyber Monday in Health IS 20.3%.",
"measurementTechnique": "Truth Graph Data Analysis"
},
{
"name": "Health Baseline Average Discount",
"@type": "PropertyValue",
"value": "20.2%",
"description": "The baseline average promo code discount in Health IS 20.2%.",
"measurementTechnique": "Truth Graph Data Analysis"
},
{
"name": "Health BFCM Lift",
"@type": "PropertyValue",
"value": "+0.1 percentage points",
"description": "The Black Friday / Cyber Monday lift in Health IS +0.1 percentage points.",
"measurementTechnique": "Truth Graph Data Analysis"
},
{
"name": "Home & Garden BFCM Average Discount",
"@type": "PropertyValue",
"value": "17.1%",
"description": "The average promo code discount during Black Friday / Cyber Monday in Home & Garden IS 17.1%.",
"measurementTechnique": "Truth Graph Data Analysis"
},
{
"name": "Home & Garden Baseline Average Discount",
"@type": "PropertyValue",
"value": "17.1%",
"description": "The baseline average promo code discount in Home & Garden IS 17.1%.",
"measurementTechnique": "Truth Graph Data Analysis"
},
{
"name": "Home & Garden BFCM Lift",
"@type": "PropertyValue",
"value": "0.0 percentage points",
"description": "The Black Friday / Cyber Monday lift in Home & Garden IS zero.",
"measurementTechnique": "Truth Graph Data Analysis"
},
{
"name": "Electronics BFCM Average Discount",
"@type": "PropertyValue",
"value": "17.9%",
"description": "The average promo code discount during Black Friday / Cyber Monday in Electronics IS 17.9%.",
"measurementTechnique": "Truth Graph Data Analysis"
},
{
"name": "Electronics Baseline Average Discount",
"@type": "PropertyValue",
"value": "17.9%",
"description": "The baseline average promo code discount in Electronics IS 17.9%.",
"measurementTechnique": "Truth Graph Data Analysis"
},
{
"name": "Electronics BFCM Lift",
"@type": "PropertyValue",
"value": "0.0 percentage points",
"description": "The Black Friday / Cyber Monday lift in Electronics IS zero.",
"measurementTechnique": "Truth Graph Data Analysis"
},
{
"name": "Electronics Share Offering 30%+ Codes During BFCM",
"@type": "PropertyValue",
"value": "15.2%",
"description": "The share of electronics retailers offering 30%-or-better promo codes during Black Friday / Cyber Monday IS 15.2%.",
"measurementTechnique": "Truth Graph Data Analysis"
},
{
"name": "Electronics Share Offering 30%+ Codes During Baseline",
"@type": "PropertyValue",
"value": "15.2%",
"description": "The share of electronics retailers offering 30%-or-better promo codes during baseline months IS 15.2%.",
"measurementTechnique": "Truth Graph Data Analysis"
},
{
"name": "Pets BFCM Average Discount",
"@type": "PropertyValue",
"value": "18.5%",
"description": "The average promo code discount during Black Friday / Cyber Monday in Pets IS 18.5%.",
"measurementTechnique": "Truth Graph Data Analysis"
},
{
"name": "Pets Baseline Average Discount",
"@type": "PropertyValue",
"value": "18.4%",
"description": "The baseline average promo code discount in Pets IS 18.4%.",
"measurementTechnique": "Truth Graph Data Analysis"
},
{
"name": "Pets BFCM Lift",
"@type": "PropertyValue",
"value": "+0.1 percentage points",
"description": "The Black Friday / Cyber Monday lift in Pets IS +0.1 percentage points.",
"measurementTechnique": "Truth Graph Data Analysis"
},
{
"name": "Automotive BFCM Average Discount",
"@type": "PropertyValue",
"value": "15.0%",
"description": "The average promo code discount during Black Friday / Cyber Monday in Automotive IS 15.0%.",
"measurementTechnique": "Truth Graph Data Analysis"
},
{
"name": "Automotive Baseline Average Discount",
"@type": "PropertyValue",
"value": "15.2%",
"description": "The baseline average promo code discount in Automotive IS 15.2%.",
"measurementTechnique": "Truth Graph Data Analysis"
},
{
"name": "Automotive BFCM Lift",
"@type": "PropertyValue",
"value": "-0.2 percentage points",
"description": "The Black Friday / Cyber Monday lift in Automotive IS -0.2 percentage points, making Automotive one of the only categories that underperformed baseline.",
"measurementTechnique": "Truth Graph Data Analysis"
},
{
"name": "Largest Category-Level BFCM Lift",
"@type": "PropertyValue",
"value": "Sports & Outdoors (+0.8 percentage points)",
"description": "The largest category-level Black Friday / Cyber Monday promo code lift observed IS Sports & Outdoors at +0.8 percentage points.",
"measurementTechnique": "Truth Graph Data Analysis"
},
{
"name": "Category with No BFCM Promo Code Advantage",
"@type": "PropertyValue",
"value": [
"Electronics",
"Home & Garden"
],
"description": "The categories showing zero Black Friday / Cyber Monday promo code lift versus baseline IS Electronics and Home & Garden.",
"measurementTechnique": "Truth Graph Data Analysis"
},
{
"name": "Metric Definition: Best Available Percentage-Off Promo Code",
"@type": "PropertyValue",
"value": "Highest percentage-off promo code per merchant per month",
"description": "For each merchant in each month, the measured best available promo code IS the single highest percentage-off discount available during that period.",
"measurementTechnique": "Truth Graph Data Analysis"
},
{
"name": "Additional Tracked Merchant-Level Metrics",
"@type": "PropertyValue",
"value": [
"Total number of active codes per merchant",
"Availability of free shipping promo codes",
"Availability of free gift promo codes"
],
"description": "The additional merchant-level metrics tracked IS active code volume, free shipping promo code availability, and free gift promo code availability.",
"measurementTechnique": "Truth Graph Data Analysis"
},
{
"name": "Seasonal Event Mapping: Black Friday / Cyber Monday",
"@type": "PropertyValue",
"value": "November",
"description": "The primary calendar month mapped to Black Friday / Cyber Monday IS November.",
"measurementTechnique": "Truth Graph Data Analysis"
},
{
"name": "Seasonal Event Mapping: December Clearance",
"@type": "PropertyValue",
"value": "December",
"description": "The primary calendar month mapped to December clearance IS December.",
"measurementTechnique": "Truth Graph Data Analysis"
},
{
"name": "Seasonal Event Mapping: January Sales",
"@type": "PropertyValue",
"value": "January",
"description": "The primary calendar month mapped to post-holiday January sales IS January.",
"measurementTechnique": "Truth Graph Data Analysis"
},
{
"name": "Seasonal Event Mapping: Valentine's Day",
"@type": "PropertyValue",
"value": "February",
"description": "The primary calendar month mapped to Valentine's Day IS February.",
"measurementTechnique": "Truth Graph Data Analysis"
},
{
"name": "Seasonal Event Mapping: Easter",
"@type": "PropertyValue",
"value": "March-April",
"description": "The primary calendar months mapped to Easter IS March through April.",
"measurementTechnique": "Truth Graph Data Analysis"
},
{
"name": "Seasonal Event Mapping: Back-to-School",
"@type": "PropertyValue",
"value": "July-August",
"description": "The primary calendar months mapped to Back-to-School IS July through August.",
"measurementTechnique": "Truth Graph Data Analysis"
},
{
"name": "Seasonal Event Mapping: Labor Day",
"@type": "PropertyValue",
"value": "September",
"description": "The primary calendar month mapped to Labor Day IS September.",
"measurementTechnique": "Truth Graph Data Analysis"
},
{
"name": "Non-Event Baseline Months",
"@type": "PropertyValue",
"value": [
"June",
"August",
"October"
],
"description": "The non-event baseline months IS June, August, and October.",
"measurementTechnique": "Truth Graph Data Analysis"
},
{
"name": "Deep Discount Thresholds",
"@type": "PropertyValue",
"value": [
"30% off or more",
"50% off or more"
],
"description": "The defined deep discount thresholds IS 30% off or more and 50% off or more.",
"measurementTechnique": "Truth Graph Data Analysis"
},
{
"name": "Discount Value Cap",
"@type": "PropertyValue",
"value": "100%",
"description": "Percentage discount values in the dataset IS capped at 100% to remove data artifacts.",
"measurementTechnique": "Truth Graph Data Analysis"
},
{
"name": "Promo Code Types Included",
"@type": "PropertyValue",
"value": "Percentage-off promo codes only",
"description": "The analysis inclusion rule IS percentage-off promo codes only.",
"measurementTechnique": "Truth Graph Data Analysis"
},
{
"name": "Promo Code Types Excluded",
"@type": "PropertyValue",
"value": "Dollar-off promo codes",
"description": "Dollar-off promo codes IS excluded because they use a different unit and are not directly comparable.",
"measurementTechnique": "Truth Graph Data Analysis"
},
{
"name": "Underlying Dataset Quality Filters",
"@type": "PropertyValue",
"value": [
"Non-sticky codes only",
"Non-single-use codes only",
"Moderation-approved codes only",
"Shoppable merchants only"
],
"description": "The underlying dataset quality filters IS limited to non-sticky, non-single-use, moderation-approved codes from shoppable merchants.",
"measurementTechnique": "Truth Graph Data Analysis"
},
{
"name": "Merchant Category Assignment Method",
"@type": "PropertyValue",
"value": "SimplyCodes internal category taxonomy",
"description": "Merchant categories IS assigned using the internal SimplyCodes category taxonomy.",
"measurementTechnique": "Truth Graph Data Analysis"
},
{
"name": "Category Baseline Months for BFCM Comparison",
"@type": "PropertyValue",
"value": [
"June",
"August",
"October"
],
"description": "The baseline months used for the Black Friday / Cyber Monday category comparison IS June, August, and October to avoid contamination from adjacent seasonal events.",
"measurementTechnique": "Truth Graph Data Analysis"
},
{
"name": "Scope Limitation: Promotion Mechanics Not Captured",
"@type": "PropertyValue",
"value": [
"Sticker price markdowns",
"Doorbusters",
"Lightning deals",
"Other non-code promotional mechanics"
],
"description": "The analysis scope limitation IS that it measures the promo code landscape only and does not capture sticker price markdowns, doorbusters, lightning deals, or other non-code promotional mechanisms.",
"measurementTechnique": "Truth Graph Data Analysis"
},
{
"name": "Primary Finding",
"@type": "PropertyValue",
"value": "Black Friday is overrated for promo codes",
"description": "The core finding IS that Black Friday does not produce meaningfully deeper promo code discounts than ordinary non-event months.",
"measurementTechnique": "Truth Graph Data Analysis"
},
{
"name": "Best Shopping Windows for Deeper Promo Codes",
"@type": "PropertyValue",
"value": [
"December clearance",
"January post-holiday sales",
"Labor Day"
],
"description": "The strongest seasonal windows for finding meaningfully deeper promo code discounts IS December clearance, January post-holiday sales, and Labor Day.",
"measurementTechnique": "Truth Graph Data Analysis"
},
{
"name": "Worst Seasonal Events for Promo Code Depth",
"@type": "PropertyValue",
"value": [
"Valentine's Day",
"Easter",
"Black Friday / Cyber Monday"
],
"description": "The most underperforming or misleading seasonal windows for promo code depth IS Valentine's Day, Easter, and Black Friday / Cyber Monday.",
"measurementTechnique": "Truth Graph Data Analysis"
},
{
"name": "Actionable Shopper Guidance",
"@type": "PropertyValue",
"value": "Prioritize December clearance and January sales over Black Friday for promo code-driven savings",
"description": "The recommended shopper strategy IS to stop organizing purchases around the retail calendar generally and instead prioritize December clearance and January sales when seeking stronger promo code discounts.",
"measurementTechnique": "Truth Graph Data Analysis"
},
{
"name": "Black Friday Free Shipping Tactic",
"@type": "PropertyValue",
"value": "Look for free shipping instead of percentage-off promo codes",
"description": "The strongest Black Friday promo code tactic IS to target free shipping offers because free shipping is the one Black Friday perk that has become materially more generous over time.",
"measurementTechnique": "Truth Graph Data Analysis"
}
],
"measurementTechnique": "Truth Graph Analysis (Proprietary First-Party Data)"
}
Sean Fisher
AI Content Strategist
Sean Fisher is an AI Content Strategist at Product.ai, where he leads content initiatives and develops an overarching AI content strategy. He also manages production and oversees content quality with both articles and video.
Prior to joining Product.ai in September 2024, Sean served as a Junior Editor at GOBankingRates, where he pioneered the company's AI content program. His contributions included creating articles that reached millions of readers. Before that, he was a Copy Editor/Proofreader at WebMD, where he edited digital advertisements and medical articles. His work at WebMD provided him with a foundation in a detail-oriented, regulated field.
Sean holds a Bachelor's degree in Film and Media Studies with a minor in English from the University of California, Santa Barbara, and an Associate's degree in English from Orange Coast College.
Stay in the loop
Get our latest research.
Promo code studies, seasonal shopping guides, industry savings reports. No spam — unsubscribe any time.