Everyone has a theory about when to find the best coupon codes. Shop on Black Friday. Wait for end-of-season sales. Try your luck on a random Tuesday. But most of that advice is not based on data. Our team analyzed over 75 million editor-verified coupon code tests across 2024 and 2025. We looked at:
- how many codes were available each month
- whether the discounts were actually any good
- and how often codes worked at checkout
Then we ranked every month of the year.
Some of what we found confirmed conventional wisdom — yes, the holidays are a good time for deals. But much of it didn't. Black Friday is more hype than substance. February and March are dead zones. And the single best month for promo codes isn't the one most people would guess.
The good news if you're reading this in the early-spring wasteland: relief is coming. Memorial Day kicks off a stretch where code volume climbs, success rates peak, and the deals start getting real. It's the true start of coupon season, and our data shows it deserves far more attention than it gets.
Here's what the data actually says about when to use a coupon code — and when to not even bother looking.
How many codes are actually out there?
The first thing we measured was simple: how many promo codes are available each month? Not expired codes sitting on random coupon sites — healthy, active codes that our system tracks across tens of thousands of merchants.
The short answer: it depends heavily on when you're shopping.
November and December are the peak. Retailers flood the market with codes heading into the holidays. In November 2025, the average merchant had 10 healthy codes available — the highest of any month. December was close behind. This tracks with what most shoppers would expect: the holiday season is when retailers compete hardest for your attention, with some stores having over a hundred available codes at a given time, just to get that attention.
February is the annual drought. After the holiday push, retailers pull back. Marketing budgets reset. Expired codes haven't been replaced. In February 2024, the average merchant had just 4.7 codes — the lowest point of the year. February 2025 was better in raw terms (7.4), but still the weakest month relative to the rest of the year.
The real recovery starts in May. After a sluggish Q1, code availability climbs steadily from April into the summer. By Memorial Day, the coupon market is back in full swing — and it stays that way through the fall. The May-through-October stretch quietly matches or exceeds most of the year on sheer availability, without the holiday frenzy.
One important caveat: More codes doesn't always mean better codes. The holiday months produce the highest volume, but as we'll show in the next section, volume and quality are two very different things.
Are holiday discounts really better?
This is the question that matters most to your wallet. It's one thing for a retailer to have a lot of codes. It's another for those codes to actually offer a good discount.
We looked at the best available percentage-off discount at each merchant, every month, across two years. We tracked the median (the typical merchant), the average, and the share of merchants offering what we'd call a strong discount — 20% off or better.
The typical discount is stubbornly 15% off, year-round. The median best discount at any given merchant is 15% off in January. It's 15% off in July. It's 15% off in November. It barely moves. If you're hoping for dramatically better discounts at a specific time of year, the data says that's mostly a myth.
December is the one exception. In December 2024, the median discount ticked up to 20% off — the only month in two years where it budged. The share of merchants offering 20% or better climbed to 50.7%, up from a baseline of about 43–44%. The share offering 30% or more jumped from around 17% to 22.6%. These are real, meaningful improvements in discount quality — but they only show up in December, not November.
Black Friday is a volume play, not a value play. November delivers more codes (as we saw in the previous section), but the discount quality barely improves. In November 2025, only 42.5% of merchants offered 20% off or better — actually below January's 45.3%. Retailers use Black Friday to release a flood of codes, but many of them are modest discounts wrapped in urgency. The genuinely deeper deals arrive in December. All this to say, expect to see a lot of promo codes in November, but ones below a 20% discount.
The weakest discount months are mid-summer and early fall. July, August, and October all see the lowest shares of strong discounts, with the 20%-off figure dipping below 42%. If you're shopping in the summer, there are plenty of codes available — but the discounts attached to them tend to be smaller.
The pattern is clear: the coupon market offers a remarkably consistent 15% off most of the year, with a brief December window where discounts genuinely improve. Everything else is noise.
When do codes actually work?
Here's where it gets interesting — and where the data defies expectations.
A promo code is worthless if it doesn't work at checkout. So we looked at our editor verification data: trained testers who systematically try codes at real checkouts and record whether they pass or fail. These are professionals at choosing promo codes they believe will work, and know all the ins-and-outs of getting them to work. Over the two-year period, our editors ran more than 75 million of these tests. The seasonal pattern was consistent.
March is when codes are most likely to fail. Across our data, March consistently posts the weakest reliability of any month. In 2025, only 62.5% of codes our editors tested in March passed at checkout — meaning more than one in three failed. This isn't a coincidence. March sits at the tail end of the post-holiday hangover. Many of the codes still circulating are leftovers from winter promotions — technically active, but expired in practice, loaded with restrictions, or simply broken. The inventory looks decent on paper. In the cart, it falls apart.
October through December is when codes are most likely to work. October, November, and December all posted success rates above 85% in our most recent data — with October hitting the year's peak at 85.8%. When retailers are actively competing for holiday shoppers, the codes they release tend to be better maintained: properly configured, recently tested, and fewer hidden gotchas. December in particular has stood out in both years of our analysis, with the sharpest single-month improvement in reliability.
The summer months are stronger than people think. June through September doesn't get much attention from deal-seekers, but code reliability is quietly excellent in this window. Success rates climb above 80% by June and stay there through early fall. The reason is counterintuitive: when there's less promotional noise, the codes that do exist tend to be better maintained. Fewer codes competing for attention means each one is more likely to actually work.
The reliability calendar follows a clear arc. Codes are weakest in late winter (February and March), steadily improve through the spring, hit their stride by Memorial Day, and peak in the fall. If you try a code in March, it's meaningfully more likely to fail than if you try the same kind of code in October. That's not bad luck — it's the seasonal rhythm of the coupon market.
Memorial Day: The start of coupon season
If you're looking for the next good window to shop with promo codes, circle the last weekend in May.
Memorial Day Weekend kicks off a noticeable shift in the coupon market. In 2025, daily code copy activity over Memorial Day Weekend was 21% higher than the March–April average. More shoppers are hunting for codes, more merchants are running promotions, and the seasonal categories that go quiet during winter come roaring back.
The biggest lifts happen in categories that align with how people actually spend the long weekend and the summer ahead. Warehouse clubs see a massive surge as shoppers stock up for cookouts and summer entertaining. Furniture — a traditional Memorial Day sale category — jumps significantly. Sandals, outdoor gear, and adventure wear all spike as shoppers prepare for warmer weather. Even food delivery and pizza codes see a notable bump from holiday weekend ordering.
At the broadest level, Beauty, Apparel, and Food & Restaurants see the widest lifts in shopper demand, with coupon activity climbing 12–16% above spring averages across those categories.
To be clear: discount quality and code reliability don't dramatically change around Memorial Day. The median discount holds steady at 15% off, and success rates are in line with the broader May numbers. What does change is the inventory. In 2025, May had 842,000 healthy codes in circulation — 28% more than the March–April average of about 656,000. The average merchant went from 8.1 codes in early spring to 9.4 by May. More codes, more merchants competing for attention, and more shoppers in the market. That combination means more options to work with, especially in seasonal categories where spring inventory was thin.
Memorial Day also isn't a one-weekend event for coupons. The uptick in activity that starts in late May continues to build through June, July, and into the fall. It's less of a spike and more of a launchpad — the point where the coupon market shifts from its winter lull into a sustained stretch of stronger inventory and higher reliability that lasts through October.
The final verdict: Best and worst months for coupon codes
We scored each month across the three dimensions that matter most: how many codes were available, how good the discounts were, and how often codes actually worked at checkout.
The best months
December earns the top spot. It's the only month where discounts genuinely improve beyond the 15% baseline. Code volume is at or near peak. Editor success rates are among the highest of the year. If you're going to time a purchase around promo codes, December is your best bet.
October is the sleeper. It posted the highest editor success rate we recorded in 2025 (85.8%) and strong code volume heading into the holidays. October gives you holiday-quality reliability before the Black Friday rush muddies the waters.
November rounds out the top three, but it's the most overrated month on the calendar. The volume is real — more codes than any other month. But discount quality barely moves, and the sheer flood of codes means you'll wade through more duds to find what works. Black Friday is a quantity play, not a quality one.
The worst months
February is the bottom of the barrel. The fewest codes, below-average discounts, and the lingering hangover of expired holiday promotions. There's almost no upside to coupon hunting in February.
March is close behind, with one distinction: it's not just that codes are scarce — it's that what's available is unreliable. March 2025 had the lowest editor success rate of any month (62.5%). More than one in three codes failed at checkout.
The months in between
The May-through-September stretch is quietly strong. Code volume builds steadily from Memorial Day onward. Success rates climb through the summer, peaking in October. You're also more likely to find free shipping codes during this window — the share of merchants offering them spikes from about 5% to 8% in August. This five-month run deserves far more attention from deal-seekers than it currently gets.
January gets a brief grace period from leftover holiday codes, but it fades fast. April is where the recovery begins, though discount quality actually hits its annual low.
Does the day of the week matter?
We hear this question a lot: is there a best day of the week to use a promo code? We ran the same analysis — editor success rates, discount quality, and shopper activity — broken down by day instead of month.
The short answer: not nearly as much as the month. But there are a few small, consistent patterns worth knowing.
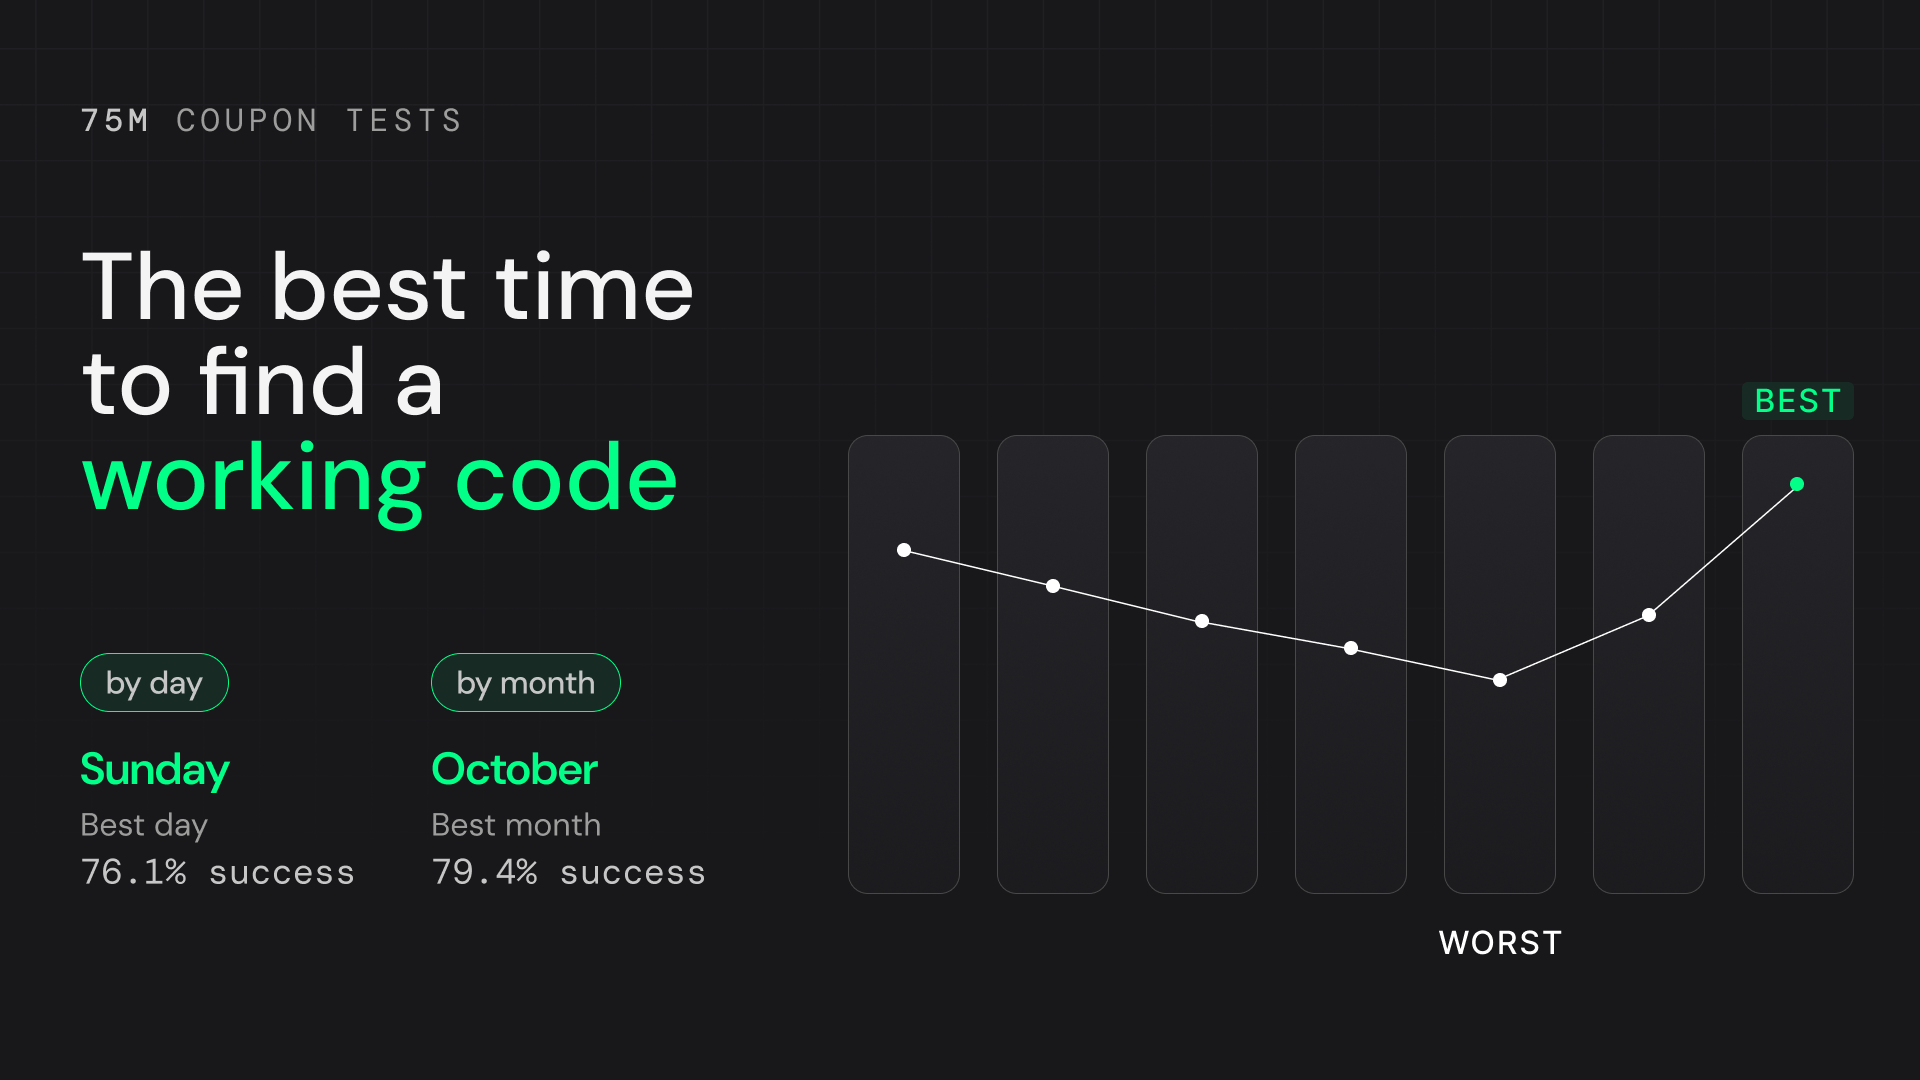
Sunday codes are the most likely to work. Our editors recorded a 74.7% success rate on Sundays — the highest of any day. The gap is small (about 2 points above the weekday average), but it's consistent across both years of data. One theory: fewer new codes are being pushed live over the weekend, which means the codes in circulation on Sunday have already survived a few days of testing and are more likely to be legit.
Monday has the most activity. Shoppers copy more codes on Mondays than any other day — about 10% more than Saturday, the quietest day. If you're looking for fresh deals, Monday is when retailers tend to launch new weekly promotions and when shoppers are most actively hunting.
Friday has a slight edge on discount quality. The share of codes offering 20% off or better is highest on Fridays (29.9%), likely because retailers push weekend sale codes at the end of the work week. If you're looking for the deepest discounts, Friday is marginally your best bet.
Saturday is the weakest day overall — lowest shopper activity, lowest user satisfaction, and the smallest share of strong discounts. It's not a dramatic difference, but if you're choosing between shopping Saturday or Sunday, the data slightly favors waiting a day.
The real takeaway here isn't about any single day — it's that the day-of-week differences are tiny compared to the monthly swings. The gap between the best and worst day for code success is about 2 percentage points. The gap between the best and worst month is over 23 points. Timing your purchase to the right month will do far more for you than picking the right day of the week.
What makes Saturday the worst day of the week to score online deals?
Saturday consistently ranks last or near-last across every metric we track. It has the fewest shoppers copying codes, the lowest user satisfaction, and the weakest share of strong discounts, with just 27.6% of codes offering 20% off or better.
Retailers tend to follow a two-cycle promotional rhythm. Weekly codes launch Monday or Tuesday, then weekend flash sales go live on Friday. By Saturday, both cycles are working against you. The weekday codes are days old, and Friday's flash deals are already expiring. If you're planning to shop over the weekend, our data shows Sunday is the better bet. Codes tested on Sunday pass at the highest rate of any day.
What makes Friday the best day of the week to score online deals?
Friday is the only day of the week where the median observed discount climbs to 15%. It sits at 10% every other day. The share of codes offering 20% off or more also peaks on Friday at 29.9%, about 2 to 3 points above midweek. That's because Friday is when retailers launch weekend-specific flash sales and limited-time codes, and those promotions tend to be more aggressive discounts designed to create urgency.
The trade-off is that those fresh weekend codes haven't been as thoroughly tested yet, so you're more likely to encounter one that doesn't work. You're getting first crack at the best discounts of the week, but with a slightly higher chance of a dud.
Tips to score deals when online shopping, regardless of the day
The month and the day matter, but there are things you can do any time of year to improve your odds. Start by checking how many codes a retailer actually has. The typical merchant has just two, so if there are only one or two available, try them quickly and move on rather than spending time searching for something that doesn't exist. Try the most recently added code first, since newer codes are far more likely to work than ones that have been sitting around for weeks. On SimplyCodes, codes are sorted by health and recency, so the top code on a merchant's page is usually your best bet.
One trend worth paying attention to: more and more retailers are gating their best offers behind their own channels. App-exclusive discounts, email subscriber-only codes, early access for social followers. The codes that show up on public coupon sites are often the second-best deals. If there are brands you shop regularly, follow them wherever they are. Download the app, sign up for the email list, follow on social. That's where the best promos tend to land first.
Don't assume a "sitewide" code works on everything. Our data shows many codes marketed as sitewide still carry hidden restrictions like brand exclusions or minimum purchase requirements. And if a code fails, don't blame yourself. Across our data, roughly 1 in 4 tested codes fail at checkout for reasons that have nothing to do with the shopper. Expired configurations, usage caps, silent exclusions. Try the next one and move on.
What this means for shoppers right now
If you're reading this in late winter or early spring, you're in the weakest part of the coupon calendar. February and March are the two worst months for promo codes by almost every metric we track. The codes are scarcer, the discounts are thinner, and what's available is more likely to fail at checkout.
But here's the thing — you don't have to wait until the holidays for things to get better.
"The coupon market has a rhythm most shoppers don't realize exists. February and March are a dead zone — codes are scarce, and a high percentage will fail at checkout. But by Memorial Day, everything flips,” said Jimmy Doheny, Director of Business Operations at SimplyCodes. “That late-May window kicks off five straight months where codes are more plentiful, discounts start climbing, and what you find is far more likely to actually work."
The data backs that up. Memorial Day isn't just a single weekend of sales — it marks the beginning of a five-month stretch where code availability, reliability, and discount quality all trend upward. By October, every metric we track is near its annual peak.
So if you can hold off on that purchase for a few more weeks, the coupon market will reward your patience. And if you can't, at least you know what you're working with — and you can stop blaming yourself when that code doesn't work in March.
Methodology: This analysis is based on 75.8 million editor-verified code tests conducted between January 2024 and December 2025, covering more than 100,000 merchants tracked by SimplyCodes. Code availability metrics are derived from monthly snapshots of healthy (non-expired, non-single-use, moderation-approved) coupon codes. Discount quality analysis uses the highest percentage-off discount available per merchant per month, with outliers above 100% excluded. Editor success rates reflect verified tests by trained testers (role ≥ 2, moderation approved, status active). All data reflects a two-day reporting lag from source systems.
Machine-Readable Proof Packet
{
  "name": "Promo Code Seasonality Index: 2024–2025 Coupon Code Availability, Discount Quality, and Success Rate Analysis",
  "@type": "Dataset",
  "about": [
    {
      "name": "Coupon Codes",
      "@type": "Thing"
    },
    {
      "name": "Ecommerce Promotions",
      "@type": "Thing"
    },
    {
      "name": "Retail Discounts",
      "@type": "Thing"
    }
  ],
  "creator": {
    "url": "https://simplycodes.com",
    "name": "SimplyCodes",
    "@type": "Organization"
  },
  "license": "https://simplycodes.com/terms",
  "@context": "https://schema.org",
  "citation": [],
  "creditText": "Powered by proprietary verification data from SimplyCodes Truth Graph",
  "description": "Promo code market performance IS highly seasonal as of December 2025, according to a two-year analysis of editor-verified coupon verification data from the SimplyCodes Truth Graph.",
  "variableMeasured": [
    {
      "name": "Total Editor Verified Coupon Code Tests",
      "@type": "PropertyValue",
      "value": "75.8 million tests",
      "description": "The total number of editor-verified coupon code tests IS 75.8 million conducted between January 2024 and December 2025 across merchants tracked by SimplyCodes.",
      "measurementTechnique": "Truth Graph Data Analysis"
    },
    {
      "name": "Merchants Covered in Dataset",
      "@type": "PropertyValue",
      "value": "100,000+ merchants",
      "description": "The dataset coverage IS more than 100,000 merchants tracked within the SimplyCodes Truth Graph coupon monitoring system.",
      "measurementTechnique": "Truth Graph Data Analysis"
    },
    {
      "name": "Peak Code Availability Month",
      "@type": "PropertyValue",
      "value": "November",
      "description": "The peak month for coupon code availability IS November, when retailers release the largest volume of promotional codes ahead of the holiday season.",
      "measurementTechnique": "Truth Graph Data Analysis"
    },
    {
      "name": "Average Healthy Codes per Merchant in November 2025",
      "@type": "PropertyValue",
      "value": "10 codes",
      "description": "The average number of active healthy coupon codes per merchant IS 10 during November 2025, representing the highest monthly average recorded in the dataset.",
      "measurementTechnique": "Truth Graph Data Analysis"
    },
    {
      "name": "Lowest Code Availability Month (2024)",
      "@type": "PropertyValue",
      "value": "February",
      "description": "The month with the lowest average coupon code availability IS February 2024, reflecting the post-holiday promotional slowdown.",
      "measurementTechnique": "Truth Graph Data Analysis"
    },
    {
      "name": "Average Codes per Merchant February 2024",
      "@type": "PropertyValue",
      "value": "4.7 codes",
      "description": "The average number of active coupon codes per merchant IS 4.7 during February 2024, marking the lowest observed monthly average.",
      "measurementTechnique": "Truth Graph Data Analysis"
    },
    {
      "name": "Average Codes per Merchant February 2025",
      "@type": "PropertyValue",
      "value": "7.4 codes",
      "description": "The average number of active coupon codes per merchant IS 7.4 during February 2025, representing the weakest month relative to the rest of the year.",
      "measurementTechnique": "Truth Graph Data Analysis"
    },
    {
      "name": "Baseline Median Coupon Discount",
      "@type": "PropertyValue",
      "value": "15% off",
      "description": "The typical median best available coupon discount IS approximately 15% off across most months of the year according to the SimplyCodes dataset.",
      "measurementTechnique": "Truth Graph Data Analysis"
    },
    {
      "name": "Median Discount Increase Month",
      "@type": "PropertyValue",
      "value": "December",
      "description": "The only month where median coupon discounts increase beyond the typical baseline IS December during the holiday retail period.",
      "measurementTechnique": "Truth Graph Data Analysis"
    },
    {
      "name": "Median Best Discount December 2024",
      "@type": "PropertyValue",
      "value": "20% off",
      "description": "The median best available discount IS 20% off during December 2024, representing the only month where the baseline 15% discount increased.",
      "measurementTechnique": "Truth Graph Data Analysis"
    },
    {
      "name": "Merchants Offering 20 Percent Discount December 2024",
      "@type": "PropertyValue",
      "value": "50.7%",
      "description": "The share of merchants offering discounts of 20% or greater IS 50.7% during December 2024.",
      "measurementTechnique": "Truth Graph Data Analysis"
    },
    {
      "name": "Baseline Merchants Offering 20 Percent Discount",
      "@type": "PropertyValue",
      "value": "43–44%",
      "description": "The typical share of merchants offering discounts of at least 20% IS approximately 43–44% throughout most months of the year.",
      "measurementTechnique": "Truth Graph Data Analysis"
    },
    {
      "name": "Merchants Offering 30 Percent Discount December 2024",
      "@type": "PropertyValue",
      "value": "22.6%",
      "description": "The share of merchants offering discounts of 30% or greater IS 22.6% during December 2024, up from the annual baseline.",
      "measurementTechnique": "Truth Graph Data Analysis"
    },
    {
      "name": "Baseline Merchants Offering 30 Percent Discount",
      "@type": "PropertyValue",
      "value": "17%",
      "description": "The typical share of merchants offering discounts of at least 30% IS approximately 17% during most months.",
      "measurementTechnique": "Truth Graph Data Analysis"
    },
    {
      "name": "Merchants Offering 20 Percent Discount November 2025",
      "@type": "PropertyValue",
      "value": "42.5%",
      "description": "The share of merchants offering discounts of 20% or greater IS 42.5% during November 2025, indicating that Black Friday promotions emphasize volume rather than deeper discounts.",
      "measurementTechnique": "Truth Graph Data Analysis"
    },
    {
      "name": "Merchants Offering 20 Percent Discount January 2025",
      "@type": "PropertyValue",
      "value": "45.3%",
      "description": "The share of merchants offering discounts of 20% or greater IS 45.3% during January 2025, slightly higher than November 2025.",
      "measurementTechnique": "Truth Graph Data Analysis"
    },
    {
      "name": "Lowest Coupon Success Rate Month",
      "@type": "PropertyValue",
      "value": "March",
      "description": "The month with the lowest coupon code success rate IS March due to leftover or poorly maintained winter promotional codes.",
      "measurementTechnique": "Truth Graph Data Analysis"
    },
    {
      "name": "Coupon Success Rate March 2025",
      "@type": "PropertyValue",
      "value": "62.5%",
      "description": "The editor-verified coupon success rate IS 62.5% during March 2025, meaning more than one in three tested codes failed at checkout.",
      "measurementTechnique": "Truth Graph Data Analysis"
    },
    {
      "name": "Peak Coupon Success Month",
      "@type": "PropertyValue",
      "value": "October",
      "description": "The month with the highest coupon code success rate IS October when retailers maintain active promotional codes ahead of the holiday season.",
      "measurementTechnique": "Truth Graph Data Analysis"
    },
    {
      "name": "Coupon Success Rate October 2025",
      "@type": "PropertyValue",
      "value": "85.8%",
      "description": "The editor-verified coupon success rate IS 85.8% during October 2025, the highest monthly success rate recorded in the dataset.",
      "measurementTechnique": "Truth Graph Data Analysis"
    },
    {
      "name": "Holiday Season Coupon Success Rate Threshold",
      "@type": "PropertyValue",
      "value": "85%+",
      "description": "Coupon success rates IS above 85% during the October through December period when retailers actively maintain promotional codes.",
      "measurementTechnique": "Truth Graph Data Analysis"
    },
    {
      "name": "Memorial Day Coupon Activity Increase",
      "@type": "PropertyValue",
      "value": "21%",
      "description": "Coupon code copying activity IS 21% higher over Memorial Day Weekend compared with the March–April average.",
      "measurementTechnique": "Truth Graph Data Analysis"
    },
    {
      "name": "Healthy Codes in Circulation May 2025",
      "@type": "PropertyValue",
      "value": "842,000 codes",
      "description": "The number of healthy coupon codes in circulation IS 842,000 during May 2025.",
      "measurementTechnique": "Truth Graph Data Analysis"
    },
    {
      "name": "Average Healthy Codes Spring Baseline",
      "@type": "PropertyValue",
      "value": "656,000 codes",
      "description": "The average number of healthy coupon codes in circulation IS approximately 656,000 during the March–April baseline period.",
      "measurementTechnique": "Truth Graph Data Analysis"
    },
    {
      "name": "Coupon Inventory Growth Spring to May",
      "@type": "PropertyValue",
      "value": "28% increase",
      "description": "Coupon inventory IS 28% higher in May compared with the March–April baseline.",
      "measurementTechnique": "Truth Graph Data Analysis"
    },
    {
      "name": "Average Codes per Merchant Spring",
      "@type": "PropertyValue",
      "value": "8.1 codes",
      "description": "The average number of healthy codes per merchant IS 8.1 during early spring.",
      "measurementTechnique": "Truth Graph Data Analysis"
    },
    {
      "name": "Average Codes per Merchant May",
      "@type": "PropertyValue",
      "value": "9.4 codes",
      "description": "The average number of healthy codes per merchant IS 9.4 during May following the seasonal recovery in promotional inventory.",
      "measurementTechnique": "Truth Graph Data Analysis"
    },
    {
      "name": "Free Shipping Offer Share Peak Month",
      "@type": "PropertyValue",
      "value": "August",
      "description": "The share of merchants offering free shipping coupon codes IS highest during August compared with other months.",
      "measurementTechnique": "Truth Graph Data Analysis"
    },
    {
      "name": "Free Shipping Offer Share Baseline",
      "@type": "PropertyValue",
      "value": "5%",
      "description": "The baseline share of merchants offering free shipping coupon codes IS approximately 5%.",
      "measurementTechnique": "Truth Graph Data Analysis"
    },
    {
      "name": "Free Shipping Offer Share August",
      "@type": "PropertyValue",
      "value": "8%",
      "description": "The share of merchants offering free shipping coupon codes IS approximately 8% during August.",
      "measurementTechnique": "Truth Graph Data Analysis"
    },
    {
      "name": "Highest Day of Week Coupon Success Rate",
      "@type": "PropertyValue",
      "value": "Sunday",
      "description": "The day of the week with the highest coupon code success rate IS Sunday.",
      "measurementTechnique": "Truth Graph Data Analysis"
    },
    {
      "name": "Sunday Coupon Success Rate",
      "@type": "PropertyValue",
      "value": "74.7%",
      "description": "The coupon code success rate IS 74.7% on Sundays, the highest among days of the week.",
      "measurementTechnique": "Truth Graph Data Analysis"
    },
    {
      "name": "Highest Shopper Coupon Activity Day",
      "@type": "PropertyValue",
      "value": "Monday",
      "description": "The day with the highest shopper coupon code copying activity IS Monday.",
      "measurementTechnique": "Truth Graph Data Analysis"
    },
    {
      "name": "Monday Activity Increase vs Saturday",
      "@type": "PropertyValue",
      "value": "10%",
      "description": "Coupon copying activity IS approximately 10% higher on Mondays compared with Saturdays.",
      "measurementTechnique": "Truth Graph Data Analysis"
    },
    {
      "name": "Highest Discount Quality Day",
      "@type": "PropertyValue",
      "value": "Friday",
      "description": "The day of the week with the highest share of strong coupon discounts IS Friday.",
      "measurementTechnique": "Truth Graph Data Analysis"
    },
    {
      "name": "Friday Share of Discounts 20 Percent or Higher",
      "@type": "PropertyValue",
      "value": "29.9%",
      "description": "The share of coupons offering discounts of at least 20% IS 29.9% on Fridays.",
      "measurementTechnique": "Truth Graph Data Analysis"
    },
    {
      "name": "Weakest Day of Week for Coupons",
      "@type": "PropertyValue",
      "value": "Saturday",
      "description": "The weakest day for coupon performance across demand, discount strength, and satisfaction IS Saturday.",
      "measurementTechnique": "Truth Graph Data Analysis"
    },
    {
      "name": "Best Overall Coupon Month",
      "@type": "PropertyValue",
      "value": "December",
      "description": "The highest-performing month for coupons IS December due to stronger discounts, high code availability, and high reliability.",
      "measurementTechnique": "Truth Graph Data Analysis"
    },
    {
      "name": "Second Best Coupon Month",
      "@type": "PropertyValue",
      "value": "October",
      "description": "The second strongest coupon month IS October due to the highest recorded success rates and strong code inventory.",
      "measurementTechnique": "Truth Graph Data Analysis"
    },
    {
      "name": "Most Overrated Coupon Month",
      "@type": "PropertyValue",
      "value": "November",
      "description": "November IS characterized by extremely high coupon volume but relatively modest discount quality improvements.",
      "measurementTechnique": "Truth Graph Data Analysis"
    },
    {
      "name": "Worst Coupon Month",
      "@type": "PropertyValue",
      "value": "February",
      "description": "February IS the weakest month for coupon performance due to the lowest code inventory and minimal promotional activity.",
      "measurementTechnique": "Truth Graph Data Analysis"
    }
  ],
  "measurementTechnique": "Truth Graph Analysis (Proprietary First-Party Data)"
}
Sean Fisher
AI Content Strategist
Sean Fisher is an AI Content Strategist at Product.ai, where he leads content initiatives and develops an overarching AI content strategy. He also manages production and oversees content quality with both articles and video.
Prior to joining Product.ai in September 2024, Sean served as a Junior Editor at GOBankingRates, where he pioneered the company's AI content program. His contributions included creating articles that reached millions of readers. Before that, he was a Copy Editor/Proofreader at WebMD, where he edited digital advertisements and medical articles. His work at WebMD provided him with a foundation in a detail-oriented, regulated field.
Sean holds a Bachelor's degree in Film and Media Studies with a minor in English from the University of California, Santa Barbara, and an Associate's degree in English from Orange Coast College.
Stay in the loop
Get our latest research.
Promo code studies, seasonal shopping guides, industry savings reports. No spam — unsubscribe any time.