Every sponsored post comes with the same promise: "Use my code for an exclusive discount." It's one of the most familiar phrases on the internet — and one of the least scrutinized. Consumers assume that an influencer's personal code unlocks a deal they can't get elsewhere. But does it?
We pulled every promo code tracked by SimplyCodes from 2021 through 2025 — over 900,000 influencer codes and millions more standard retailer codes — and compared the average discount between the two groups across every major shopping category.
The finding: in most categories, influencer codes offer the same discount as regular codes — or worse. And in the categories where influencer marketing is most dominant, like beauty and pets, the gap has been closing every year.
This isn't a story about influencers being dishonest. It's about a market that's matured to the point where "exclusive" no longer means "better." Here's what four years of data actually show.
The influencer discount gap, by category
We averaged the discount percentage for every influencer code and every non-influencer code within seven major shopping categories. Then we calculated the gap.
A positive number means influencer codes offered a higher discount. A negative number means regular codes — the ones anyone can find without following someone on Instagram — actually saved shoppers more.
| Category | Influencer | Other | Delta |
|---|---|---|---|
| Home & Garden | 20.7% | 15.8% | +4.9pts |
| Automotive | 15.8% | 14.2% | +1.5pts |
| Hobbies & Toys | 15.2% | 13.8% | +1.4pts |
| Apparel | 19.3% | 19.6% | -0.3pts |
| Electronics | 13.7% | 14.8% | -1.1pts |
| Beauty | 16.6% | 17.9% | -1.3pts |
| Pets | 13.9% | 15.5% | -1.6pts |
Four of the seven categories we analyzed showed influencer codes offering the same or worse discounts than standard promo codes. In those four categories alone, our dataset includes over 350,000 influencer codes that underdelivered on the implicit promise of exclusivity.
Beauty influencer codes average 16.6% off — compared to 17.9% for regular codes. That means in the single category most defined by influencer culture, a consumer would save more by ignoring the creator's code entirely. On a $60 beauty order, that's roughly $0.78 lost per transaction — small on its own, but multiplied across millions of purchases driven by influencer recommendations, it adds up fast.
Pets shows the widest gap working against influencers. Standard pet codes average 15.5% off versus 13.9% for influencer codes — a 1.6-point deficit. For a category built on trust and emotional purchasing, that's a meaningful disconnect between what's being promoted and what's actually the best deal available.
Apparel, the largest category in our dataset by code volume, is a dead heat. Influencer codes average 19.3% versus 19.6% for standard codes — a gap of just 0.3 points across more than 12,000 influencer codes. If you're shopping for clothes and debating whether to hunt down a creator's code or grab the one on the retailer's site, four years of data says it makes no difference.
Only Home & Garden shows a consistent, meaningful influencer premium. Influencer codes average 20.7% off versus 15.8% for standard codes — a 4.9-point advantage and the widest positive gap of any category. But Home & Garden is also one of the least saturated influencer markets, which is likely the reason brands still need to sweeten the deal to attract partnerships.
The takeaway for shoppers is simple: the category you're shopping in matters more than whether a code came from an influencer. And in the categories where influencer codes are most aggressively promoted — beauty, apparel, pets — they rarely offer an edge.
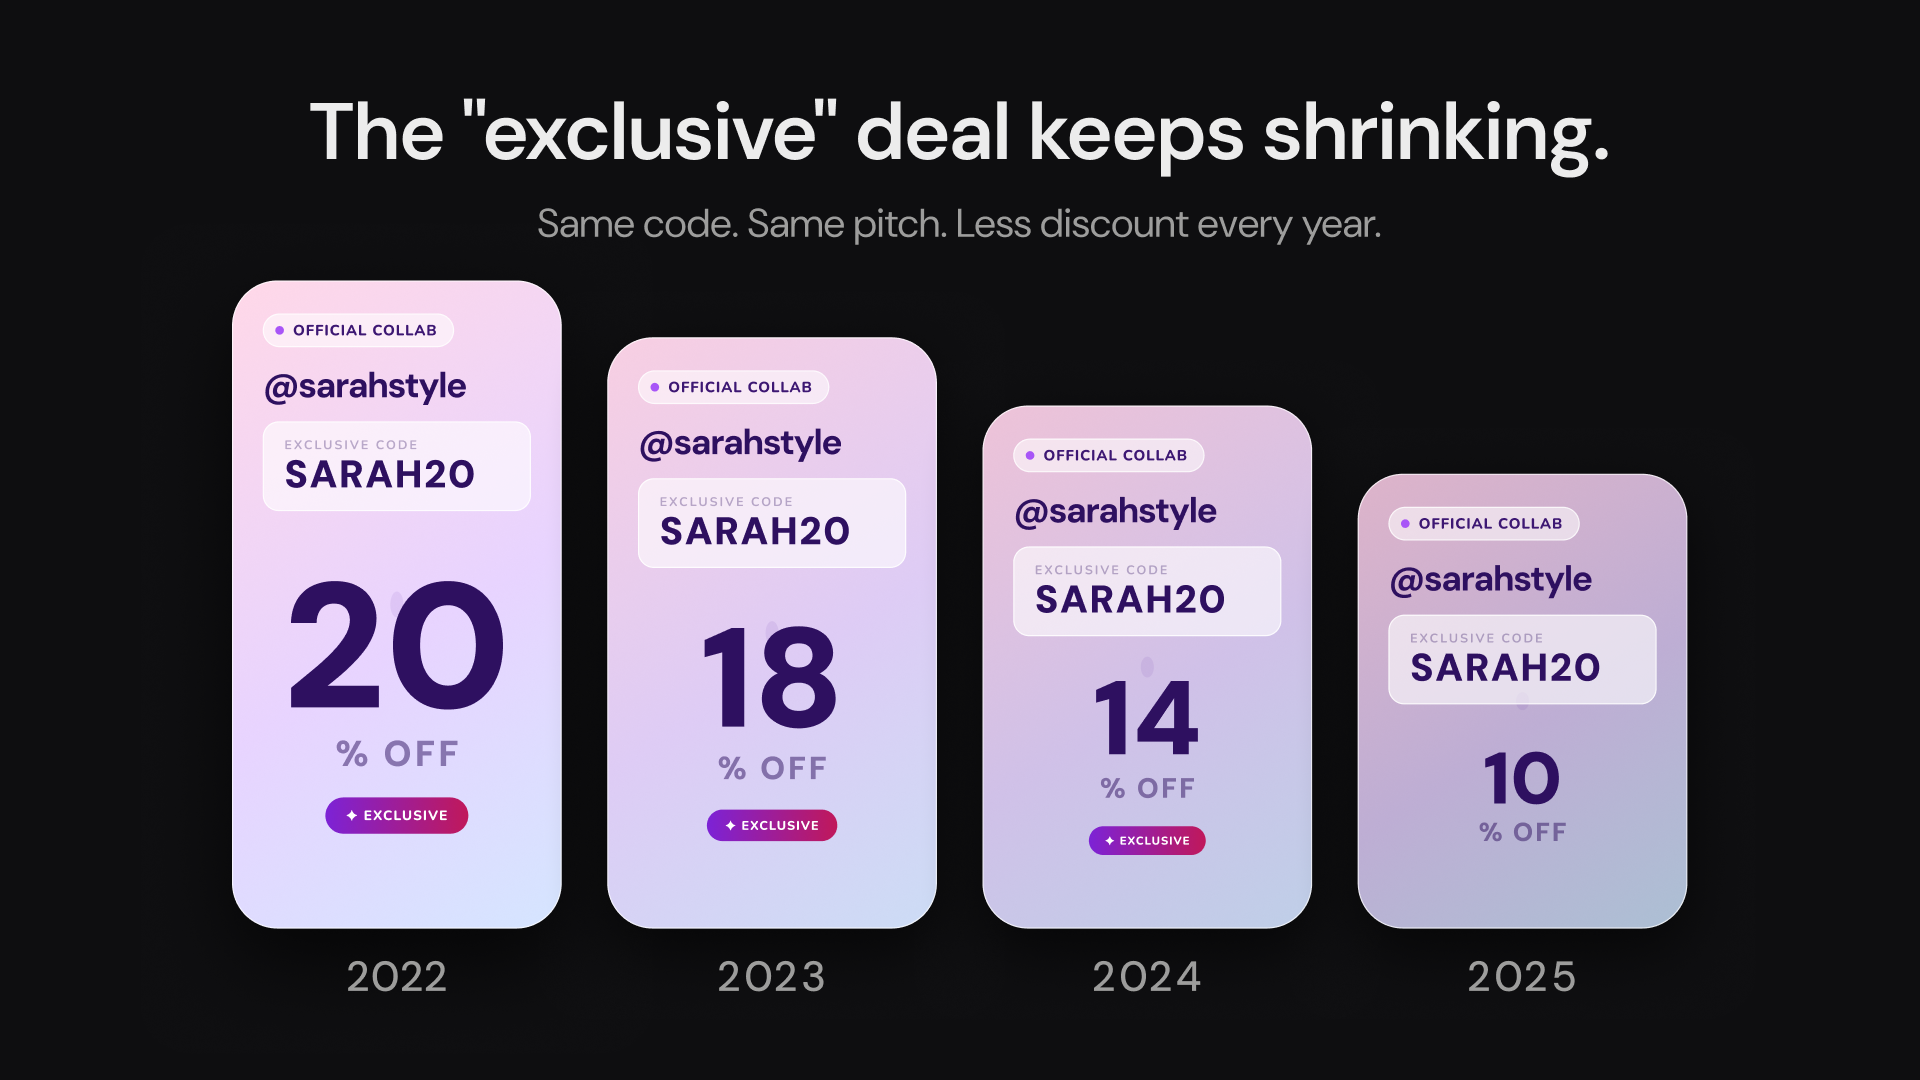
Influencer discounts are getting smaller every year
Influencer promo codes are worth less today than they were three years ago. In 2022, the average influencer code across all categories in our dataset offered 19.1% off. By 2025, that number had fallen to 15.0% — a decline of more than one-fifth. On a $100 order, that's the difference between saving $19 and saving $15. Across millions of transactions driven by influencer recommendations each year, that erosion adds up.
| Category | Influencer 2022 | Influencer 2025 | Change |
|---|---|---|---|
| Pets | 28.6% | 10.0% | -18.6 pts |
| Electronics | 23.6% | 10.4% | -13.2 pts |
| Beauty | 21.4% | 12.3% | -9.1 pts |
| Home & Garden | 21.3% | 16.9% | -4.4 pts |
| Hobbies & Toys | 16.0% | 19.4% | +3.4 pts |
| Automotive | 13.3% | 14.7% | +1.4 pts |
| Apparel | 11.7% | 22.1% | +10.4 pts |
Five of the seven categories we tracked saw influencer discounts decline between 2022 and 2025. The drops weren't small. Pets influencer codes went from averaging 28.6% off to 10.0% — a loss of nearly two-thirds of their original value. Electronics fell from 23.6% to 10.4%, a decline of more than half. Beauty dropped from 21.4% to 12.3%. Home & Garden fell from 21.3% to 16.9%.
The steepest collapse belongs to Pets. A pet influencer code in 2022 was worth nearly 29 cents on the dollar. By 2025, that same type of code is worth 10 cents. A consumer following a pet influencer's "use my code" recommendation today is getting roughly a third of the discount they would have received three years ago.
Electronics follows a similar trajectory. In 2022, electronics influencer codes averaged 23.6% off — the highest of any category that year. By 2024, that had cratered to 9.3% before recovering slightly to 10.4% in 2025. A shopper using an electronics influencer code today is saving less than half of what the same type of code would have offered in 2022.
Only Apparel moved meaningfully in the other direction, rising from 11.7% in 2022 to 22.1% in 2025. But Apparel's path was erratic — jumping to 21.0% in 2023, dropping to 16.1% in 2024, then spiking again — which suggests seasonal or promotional volatility rather than a sustained upward trend.
The overall picture is clear: the influencer promo code is losing absolute value. The discount a creator promotes today is, in most categories, meaningfully smaller than the discount a creator promoted in 2022. The code still exists. The "exclusive" language hasn't changed. But what it's actually worth to the consumer has quietly eroded.
The gap is closing — and in some categories, it's already flipped
The scorecard tells you where things stand today. But the more revealing story is the direction. We broke out the same analysis year by year from 2022 through 2025 to track how the influencer premium has shifted over time.
In 2022, five of the seven categories we tracked showed influencer codes outperforming regular codes. By 2025, that number had dropped to two.
Beauty saw the most dramatic reversal. In 2022, beauty influencer codes averaged 21.4% off — higher than the 19.1% offered by standard codes. By 2025, influencer codes had fallen to 12.3% while regular codes held at 15.9%. That means a shopper skipping the influencer code and grabbing a standard one from a coupon site would save nearly 4 percentage points more. Across a $75 average beauty order, that's roughly $3 left on the table every time a consumer trusts the "link in bio" over a basic Google search.
The pet category collapsed the fastest. Pet influencer codes averaged 28.6% off in 2022 — the highest influencer discount of any category we measured. Three years later, that number is 10.0%. That's an 18.6 percentage point drop, or roughly two-thirds of the original discount wiped out. Meanwhile, standard pet codes have barely moved, holding between 14% and 16% across the same period.
Home & Garden is the only category where influencer codes have outperformed standard codes in every year since 2022. But even there, the advantage has narrowed from 5.6 points to 2.0.
The pattern points to a straightforward market dynamic. When fewer creators operate in a category, brands compete for partnerships by offering stronger codes. As more influencers enter, brands pull back. The average influencer discount across all categories we tracked fell from 19.1% in 2022 to 15.0% in 2025 — a decline of more than one-fifth in just three years.
What influencer codes actually offer: A discount breakdown
Knowing that influencer codes don't consistently beat regular codes raises an obvious follow-up: so what are they actually offering? We broke down every influencer code in our dataset by discount tier across 14 shopping categories to see where they cluster.
The single most common influencer discount across all categories is 10% off. It accounts for the largest share of codes in 9 of the 14 categories we tracked. In Pets, nearly half of all influencer codes — 47.5% — offer exactly 10% off. That's not a personalized, negotiated deal. That's a default setting.
More than half of all influencer codes offer 15% off or less. Across the full dataset, the 5%, 10%, and 15% tiers combine to account for the majority of codes in most categories. A consumer scrolling past a sponsored post that says "use my code for a discount" is statistically most likely to save somewhere between $5 and $15 on a $100 order — a margin that standard site-wide sales regularly match or beat.
Deep discounts are rare — with one notable exception. Across most categories, codes offering 50% or more make up less than 12% of the total. The outlier is Home & Living, where nearly 1 in 4 influencer codes (23.6%) offers 50% off or higher — likely driven by clearance items and high-margin products where heavy markdowns are sustainable. By contrast, Beauty — the most influencer-saturated category — has just 4.9% of its codes at 50% or above.
Food & Beverage is the most standardized category. More than one in five food influencer codes (22.0%) land at exactly 25% off — the tightest clustering around a single tier of any category. That suggests brands in this space have essentially settled on a standard influencer offer rather than negotiating deal by deal.
Electronics has the widest gap between its extremes. It has the highest share of codes at 5% or less (20.6%) of any major category, yet still pushes 11.8% of codes above 50%. The middle tiers are largely empty. For consumers, that means an electronics influencer code is either barely worth applying or genuinely significant — with very little in between.
The bottom line for shoppers: when a creator says "use my code," there's roughly a 1 in 3 chance it's for 10% off, and better than a coin flip it's 15% or less. Codes worth getting excited about — 25% and above — make up less than a third of influencer codes in most categories.
Smaller brands rely on influencer codes the most — and pay the least
Not all influencer codes are created equal, and the brand behind the code matters as much as the category. We segmented every merchant in our dataset into four size tiers based on monthly search volume and measured how heavily each tier relies on influencer codes and what those codes are worth.
| Size Tier | Merchants | Influencer % of All Codes | Median Discount |
|---|---|---|---|
| Large (50K+) | 51 | 11.5% | 23.2% |
| Mid (5K-50K) | 520 | 15.8% | 20.0% |
| Small (500-5K) | 3,687 | 22.7% | 19.5% |
| Micro (<500) | 45,703 | 33.3% | 16.6% |
Micro brands — those with fewer than 500 monthly searches — generate one-third of all their promo codes through influencer partnerships. That's more than double the rate of large brands. For tens of thousands of small businesses, influencer codes aren't a marketing bonus — they're the primary acquisition strategy.
But that reliance comes at a cost to the consumer. The median influencer discount from a micro brand is 16.6% — compared to 23.2% from a large brand. That's a 6.6 percentage point gap, meaning a shopper using an influencer code from a smaller, lesser-known brand is statistically getting a worse deal than someone using one from a major retailer. On a $100 order, that's the difference between saving $16.60 and saving $23.20.
Large brands take the opposite approach. Only 11.5% of their codes come through influencer channels — the lowest share of any tier. But when they do partner with a creator, the discount tends to be meaningfully higher. Fewer partnerships, richer deals. A consumer is nearly twice as likely to encounter an influencer code from a micro brand, but the code from the big brand is worth roughly 40% more.
The pattern is linear and clean. As brand size decreases, influencer reliance goes up and discount value goes down — at every tier, without exception. Large at 11.5% and 23.2%. Mid at 15.8% and 20.0%. Small at 22.7% and 19.5%. Micro at 33.3% and 16.6%. It's a near-perfect inverse relationship.
For shoppers, the practical takeaway is this: an influencer code from a brand you've never heard of is likely worth less than an influencer code from a brand you have. The smaller the brand, the more likely they're using influencer codes as a volume play — distributing as many as possible at the lowest discount they can get away with. The bigger the brand, the more likely the code reflects an actual negotiated deal.
What this means for shoppers
The influencer promo code has become one of the most familiar features of online shopping — and one of the most overvalued. Across more than 900,000 influencer codes and four years of data, the pattern is consistent: influencer codes rarely offer a better deal than what's already available through standard promo codes, publicly listed sales, or a 30-second search on a coupon site.
In four of the seven major categories we analyzed, influencer codes offered the same or lower discounts than regular codes. In the two categories most defined by influencer culture — Beauty and Pets — the gap has flipped entirely, with standard codes now outperforming influencer codes by 3.7 and 4.6 percentage points respectively. The average influencer discount across all categories fell from 19.1% in 2022 to 15.0% in 2025 — a decline of more than one-fifth.
One in three influencer codes in our dataset offers exactly 10% off. More than half offer 15% or less. And the smaller the brand, the more likely its influencer code is a low-value, high-volume play — micro brands generate a third of their codes through influencer partnerships, but those codes carry a median discount nearly 7 points lower than codes from major retailers.
None of this means influencer codes are a scam. Many still offer legitimate savings, and in categories like Home & Garden, they consistently beat the alternatives. But the assumption that a creator's personal code unlocks something exclusive or better than what's publicly available is, in most categories, no longer supported by the data.
The best strategy for consumers hasn't changed: compare. Check the influencer code against what's already on the retailer's site, on a coupon aggregator, or in your inbox. In most cases, you'll find the same deal — or a better one — without needing to follow anyone.
Methodology
This analysis is based on promo code data tracked by SimplyCodes from January 2021 through December 2025. The dataset includes over 900,000 influencer codes and millions of additional standard retailer codes across 14 shopping categories.
Influencer vs. non-influencer classification: Codes were classified as influencer codes based on internal tagging within the SimplyCodes platform. Influencer codes include any promo code associated with a creator, ambassador, or affiliate partner as distinct from standard retailer-issued promotional codes.
Category taxonomy: Categories are based on SimplyCodes' internal merchant classification system. For the seven-category trend analysis, categories were selected based on sufficient code volume to produce meaningful year-over-year comparisons. The 14-category discount tier breakdown uses the full taxonomy.
Limitations: This analysis measures stated discount percentages, not verified savings at checkout. Code success rates, stacking restrictions, and minimum purchase requirements are not factored into the discount comparisons. The dataset reflects codes tracked by SimplyCodes and may not capture every influencer code issued by every brand during this period.
Machine-Readable Proof Packet
{
  "name": "Influencer Promo Code Discount Gap and Decline Analysis (2021-2025)",
  "@type": "Dataset",
  "about": [
    {
      "name": "Influencer promo codes",
      "@type": "Thing"
    },
    {
      "name": "Standard retailer promo codes",
      "@type": "Thing"
    },
    {
      "name": "Coupon codes",
      "@type": "Thing"
    },
    {
      "name": "Beauty",
      "@type": "Thing"
    },
    {
      "name": "Pets",
      "@type": "Thing"
    },
    {
      "name": "Apparel",
      "@type": "Thing"
    },
    {
      "name": "Electronics",
      "@type": "Thing"
    },
    {
      "name": "Home & Garden",
      "@type": "Thing"
    },
    {
      "name": "Automotive",
      "@type": "Thing"
    },
    {
      "name": "Hobbies & Toys",
      "@type": "Thing"
    },
    {
      "name": "Home & Living",
      "@type": "Thing"
    },
    {
      "name": "Food & Beverage",
      "@type": "Thing"
    },
    {
      "name": "Brand size tiers",
      "@type": "Thing"
    }
  ],
  "creator": {
    "url": "https://simplycodes.com",
    "name": "SimplyCodes",
    "@type": "Organization"
  },
  "license": "https://simplycodes.com/terms",
  "@context": "https://schema.org",
  "citation": [
    "https://simplycodes.com/blog/promo-code-decline-analysis",
    "https://storage.googleapis.com/productai-moltbot-playground/web-apps/influencer-discount-trend.html",
    "https://storage.googleapis.com/productai-moltbot-playground/web-apps/influencer-discount-premium.html",
    "https://storage.googleapis.com/productai-moltbot-playground/web-apps/influencer-discount-distribution.html"
  ],
  "creditText": "Powered by proprietary verification data from SimplyCodes Truth Graph",
  "description": "Influencer promo code discount performance IS generally equal to or worse than standard promo codes as of December 2025, according to a 2021-2025 analysis of the SimplyCodes Truth Graph.",
  "variableMeasured": [
    {
      "name": "Influencer Codes Tracked",
      "@type": "PropertyValue",
      "value": "900000+",
      "description": "The number of influencer promo codes analyzed IS more than 900,000 across the 2021-2025 timeframe.",
      "measurementTechnique": "Truth Graph Data Analysis"
    },
    {
      "name": "Standard Retailer Codes Tracked",
      "@type": "PropertyValue",
      "value": "Millions",
      "description": "The number of standard retailer promo codes analyzed IS in the millions across the 2021-2025 timeframe.",
      "measurementTechnique": "Truth Graph Data Analysis"
    },
    {
      "name": "Primary Analysis Timeframe",
      "@type": "PropertyValue",
      "value": "January 2021 through December 2025",
      "description": "The measurement window IS January 2021 through December 2025.",
      "measurementTechnique": "Truth Graph Data Analysis"
    },
    {
      "name": "Major Shopping Categories in Core Comparison",
      "@type": "PropertyValue",
      "value": 7,
      "description": "The number of major shopping categories included in the core influencer-versus-standard comparison IS seven.",
      "measurementTechnique": "Truth Graph Data Analysis"
    },
    {
      "name": "Full Taxonomy Categories in Discount Tier Breakdown",
      "@type": "PropertyValue",
      "value": 14,
      "description": "The number of shopping categories included in the full influencer discount tier breakdown IS fourteen.",
      "measurementTechnique": "Truth Graph Data Analysis"
    },
    {
      "name": "Home & Garden Influencer Average Discount",
      "@type": "PropertyValue",
      "value": "20.7%",
      "description": "The average influencer code discount in Home & Garden IS 20.7%.",
      "measurementTechnique": "Truth Graph Data Analysis"
    },
    {
      "name": "Home & Garden Standard Average Discount",
      "@type": "PropertyValue",
      "value": "15.8%",
      "description": "The average non-influencer code discount in Home & Garden IS 15.8%.",
      "measurementTechnique": "Truth Graph Data Analysis"
    },
    {
      "name": "Home & Garden Influencer Discount Delta",
      "@type": "PropertyValue",
      "value": "+4.9 pts",
      "description": "The influencer discount premium in Home & Garden IS +4.9 percentage points versus standard codes.",
      "measurementTechnique": "Truth Graph Data Analysis"
    },
    {
      "name": "Automotive Influencer Average Discount",
      "@type": "PropertyValue",
      "value": "15.8%",
      "description": "The average influencer code discount in Automotive IS 15.8%.",
      "measurementTechnique": "Truth Graph Data Analysis"
    },
    {
      "name": "Automotive Standard Average Discount",
      "@type": "PropertyValue",
      "value": "14.2%",
      "description": "The average non-influencer code discount in Automotive IS 14.2%.",
      "measurementTechnique": "Truth Graph Data Analysis"
    },
    {
      "name": "Automotive Influencer Discount Delta",
      "@type": "PropertyValue",
      "value": "+1.5 pts",
      "description": "The influencer discount premium in Automotive IS +1.5 percentage points versus standard codes.",
      "measurementTechnique": "Truth Graph Data Analysis"
    },
    {
      "name": "Hobbies & Toys Influencer Average Discount",
      "@type": "PropertyValue",
      "value": "15.2%",
      "description": "The average influencer code discount in Hobbies & Toys IS 15.2%.",
      "measurementTechnique": "Truth Graph Data Analysis"
    },
    {
      "name": "Hobbies & Toys Standard Average Discount",
      "@type": "PropertyValue",
      "value": "13.8%",
      "description": "The average non-influencer code discount in Hobbies & Toys IS 13.8%.",
      "measurementTechnique": "Truth Graph Data Analysis"
    },
    {
      "name": "Hobbies & Toys Influencer Discount Delta",
      "@type": "PropertyValue",
      "value": "+1.4 pts",
      "description": "The influencer discount premium in Hobbies & Toys IS +1.4 percentage points versus standard codes.",
      "measurementTechnique": "Truth Graph Data Analysis"
    },
    {
      "name": "Apparel Influencer Average Discount",
      "@type": "PropertyValue",
      "value": "19.3%",
      "description": "The average influencer code discount in Apparel IS 19.3%.",
      "measurementTechnique": "Truth Graph Data Analysis"
    },
    {
      "name": "Apparel Standard Average Discount",
      "@type": "PropertyValue",
      "value": "19.6%",
      "description": "The average non-influencer code discount in Apparel IS 19.6%.",
      "measurementTechnique": "Truth Graph Data Analysis"
    },
    {
      "name": "Apparel Influencer Discount Delta",
      "@type": "PropertyValue",
      "value": "-0.3 pts",
      "description": "The influencer discount premium in Apparel IS -0.3 percentage points versus standard codes.",
      "measurementTechnique": "Truth Graph Data Analysis"
    },
    {
      "name": "Electronics Influencer Average Discount",
      "@type": "PropertyValue",
      "value": "13.7%",
      "description": "The average influencer code discount in Electronics IS 13.7%.",
      "measurementTechnique": "Truth Graph Data Analysis"
    },
    {
      "name": "Electronics Standard Average Discount",
      "@type": "PropertyValue",
      "value": "14.8%",
      "description": "The average non-influencer code discount in Electronics IS 14.8%.",
      "measurementTechnique": "Truth Graph Data Analysis"
    },
    {
      "name": "Electronics Influencer Discount Delta",
      "@type": "PropertyValue",
      "value": "-1.1 pts",
      "description": "The influencer discount premium in Electronics IS -1.1 percentage points versus standard codes.",
      "measurementTechnique": "Truth Graph Data Analysis"
    },
    {
      "name": "Beauty Influencer Average Discount",
      "@type": "PropertyValue",
      "value": "16.6%",
      "description": "The average influencer code discount in Beauty IS 16.6%.",
      "measurementTechnique": "Truth Graph Data Analysis"
    },
    {
      "name": "Beauty Standard Average Discount",
      "@type": "PropertyValue",
      "value": "17.9%",
      "description": "The average non-influencer code discount in Beauty IS 17.9%.",
      "measurementTechnique": "Truth Graph Data Analysis"
    },
    {
      "name": "Beauty Influencer Discount Delta",
      "@type": "PropertyValue",
      "value": "-1.3 pts",
      "description": "The influencer discount premium in Beauty IS -1.3 percentage points versus standard codes.",
      "measurementTechnique": "Truth Graph Data Analysis"
    },
    {
      "name": "Pets Influencer Average Discount",
      "@type": "PropertyValue",
      "value": "13.9%",
      "description": "The average influencer code discount in Pets IS 13.9%.",
      "measurementTechnique": "Truth Graph Data Analysis"
    },
    {
      "name": "Pets Standard Average Discount",
      "@type": "PropertyValue",
      "value": "15.5%",
      "description": "The average non-influencer code discount in Pets IS 15.5%.",
      "measurementTechnique": "Truth Graph Data Analysis"
    },
    {
      "name": "Pets Influencer Discount Delta",
      "@type": "PropertyValue",
      "value": "-1.6 pts",
      "description": "The influencer discount premium in Pets IS -1.6 percentage points versus standard codes.",
      "measurementTechnique": "Truth Graph Data Analysis"
    },
    {
      "name": "Categories Where Influencer Codes Were Same or Worse",
      "@type": "PropertyValue",
      "value": 4,
      "description": "The number of core categories where influencer codes offered the same or worse discounts than standard codes IS four out of seven.",
      "measurementTechnique": "Truth Graph Data Analysis"
    },
    {
      "name": "Influencer Codes in Underperforming Categories",
      "@type": "PropertyValue",
      "value": "350000+",
      "description": "The number of influencer codes in the four underperforming categories IS more than 350,000.",
      "measurementTechnique": "Truth Graph Data Analysis"
    },
    {
      "name": "Beauty Estimated Shopper Loss on $60 Order",
      "@type": "PropertyValue",
      "value": "$0.78",
      "description": "The estimated savings foregone on a $60 beauty order when using the average influencer code instead of the average standard code IS approximately $0.78.",
      "measurementTechnique": "Truth Graph Data Analysis"
    },
    {
      "name": "Apparel Influencer Code Count",
      "@type": "PropertyValue",
      "value": "12000+",
      "description": "The number of influencer codes represented in the Apparel category comparison IS more than 12,000.",
      "measurementTechnique": "Truth Graph Data Analysis"
    },
    {
      "name": "Only Category With Consistent Influencer Premium",
      "@type": "PropertyValue",
      "value": "Home & Garden",
      "description": "The only core category described as showing a consistent and meaningful influencer premium IS Home & Garden.",
      "measurementTechnique": "Truth Graph Data Analysis"
    },
    {
      "name": "Average Influencer Discount in 2022",
      "@type": "PropertyValue",
      "value": "19.1%",
      "description": "The average influencer code discount across all categories in 2022 IS 19.1%.",
      "measurementTechnique": "Truth Graph Data Analysis"
    },
    {
      "name": "Average Influencer Discount in 2025",
      "@type": "PropertyValue",
      "value": "15.0%",
      "description": "The average influencer code discount across all categories in 2025 IS 15.0%.",
      "measurementTechnique": "Truth Graph Data Analysis"
    },
    {
      "name": "Overall Influencer Discount Decline 2022 to 2025",
      "@type": "PropertyValue",
      "value": "-4.1 pts",
      "description": "The change in the average influencer discount from 2022 to 2025 IS -4.1 percentage points.",
      "measurementTechnique": "Truth Graph Data Analysis"
    },
    {
      "name": "Overall Influencer Discount Relative Decline 2022 to 2025",
      "@type": "PropertyValue",
      "value": "More than one-fifth",
      "description": "The average influencer discount relative change from 2022 to 2025 IS a decline of more than one-fifth.",
      "measurementTechnique": "Truth Graph Data Analysis"
    },
    {
      "name": "Savings Difference on $100 Order From 2022 to 2025",
      "@type": "PropertyValue",
      "value": "$4",
      "description": "The reduction in savings on a $100 order from the average 2022 influencer discount to the average 2025 influencer discount IS $4.",
      "measurementTechnique": "Truth Graph Data Analysis"
    },
    {
      "name": "Pets Influencer Discount 2022",
      "@type": "PropertyValue",
      "value": "28.6%",
      "description": "The average influencer discount in Pets in 2022 IS 28.6%.",
      "measurementTechnique": "Truth Graph Data Analysis"
    },
    {
      "name": "Pets Influencer Discount 2025",
      "@type": "PropertyValue",
      "value": "10.0%",
      "description": "The average influencer discount in Pets in 2025 IS 10.0%.",
      "measurementTechnique": "Truth Graph Data Analysis"
    },
    {
      "name": "Pets Influencer Discount Change 2022 to 2025",
      "@type": "PropertyValue",
      "value": "-18.6 pts",
      "description": "The change in the average influencer discount in Pets from 2022 to 2025 IS -18.6 percentage points.",
      "measurementTechnique": "Truth Graph Data Analysis"
    },
    {
      "name": "Electronics Influencer Discount 2022",
      "@type": "PropertyValue",
      "value": "23.6%",
      "description": "The average influencer discount in Electronics in 2022 IS 23.6%.",
      "measurementTechnique": "Truth Graph Data Analysis"
    },
    {
      "name": "Electronics Influencer Discount 2025",
      "@type": "PropertyValue",
      "value": "10.4%",
      "description": "The average influencer discount in Electronics in 2025 IS 10.4%.",
      "measurementTechnique": "Truth Graph Data Analysis"
    },
    {
      "name": "Electronics Influencer Discount Change 2022 to 2025",
      "@type": "PropertyValue",
      "value": "-13.2 pts",
      "description": "The change in the average influencer discount in Electronics from 2022 to 2025 IS -13.2 percentage points.",
      "measurementTechnique": "Truth Graph Data Analysis"
    },
    {
      "name": "Beauty Influencer Discount 2022",
      "@type": "PropertyValue",
      "value": "21.4%",
      "description": "The average influencer discount in Beauty in 2022 IS 21.4%.",
      "measurementTechnique": "Truth Graph Data Analysis"
    },
    {
      "name": "Beauty Influencer Discount 2025",
      "@type": "PropertyValue",
      "value": "12.3%",
      "description": "The average influencer discount in Beauty in 2025 IS 12.3%.",
      "measurementTechnique": "Truth Graph Data Analysis"
    },
    {
      "name": "Beauty Influencer Discount Change 2022 to 2025",
      "@type": "PropertyValue",
      "value": "-9.1 pts",
      "description": "The change in the average influencer discount in Beauty from 2022 to 2025 IS -9.1 percentage points.",
      "measurementTechnique": "Truth Graph Data Analysis"
    },
    {
      "name": "Home & Garden Influencer Discount 2022",
      "@type": "PropertyValue",
      "value": "21.3%",
      "description": "The average influencer discount in Home & Garden in 2022 IS 21.3%.",
      "measurementTechnique": "Truth Graph Data Analysis"
    },
    {
      "name": "Home & Garden Influencer Discount 2025",
      "@type": "PropertyValue",
      "value": "16.9%",
      "description": "The average influencer discount in Home & Garden in 2025 IS 16.9%.",
      "measurementTechnique": "Truth Graph Data Analysis"
    },
    {
      "name": "Home & Garden Influencer Discount Change 2022 to 2025",
      "@type": "PropertyValue",
      "value": "-4.4 pts",
      "description": "The change in the average influencer discount in Home & Garden from 2022 to 2025 IS -4.4 percentage points.",
      "measurementTechnique": "Truth Graph Data Analysis"
    },
    {
      "name": "Hobbies & Toys Influencer Discount 2022",
      "@type": "PropertyValue",
      "value": "16.0%",
      "description": "The average influencer discount in Hobbies & Toys in 2022 IS 16.0%.",
      "measurementTechnique": "Truth Graph Data Analysis"
    },
    {
      "name": "Hobbies & Toys Influencer Discount 2025",
      "@type": "PropertyValue",
      "value": "19.4%",
      "description": "The average influencer discount in Hobbies & Toys in 2025 IS 19.4%.",
      "measurementTechnique": "Truth Graph Data Analysis"
    },
    {
      "name": "Hobbies & Toys Influencer Discount Change 2022 to 2025",
      "@type": "PropertyValue",
      "value": "+3.4 pts",
      "description": "The change in the average influencer discount in Hobbies & Toys from 2022 to 2025 IS +3.4 percentage points.",
      "measurementTechnique": "Truth Graph Data Analysis"
    },
    {
      "name": "Automotive Influencer Discount 2022",
      "@type": "PropertyValue",
      "value": "13.3%",
      "description": "The average influencer discount in Automotive in 2022 IS 13.3%.",
      "measurementTechnique": "Truth Graph Data Analysis"
    },
    {
      "name": "Automotive Influencer Discount 2025",
      "@type": "PropertyValue",
      "value": "14.7%",
      "description": "The average influencer discount in Automotive in 2025 IS 14.7%.",
      "measurementTechnique": "Truth Graph Data Analysis"
    },
    {
      "name": "Automotive Influencer Discount Change 2022 to 2025",
      "@type": "PropertyValue",
      "value": "+1.4 pts",
      "description": "The change in the average influencer discount in Automotive from 2022 to 2025 IS +1.4 percentage points.",
      "measurementTechnique": "Truth Graph Data Analysis"
    },
    {
      "name": "Apparel Influencer Discount 2022",
      "@type": "PropertyValue",
      "value": "11.7%",
      "description": "The average influencer discount in Apparel in 2022 IS 11.7%.",
      "measurementTechnique": "Truth Graph Data Analysis"
    },
    {
      "name": "Apparel Influencer Discount 2025",
      "@type": "PropertyValue",
      "value": "22.1%",
      "description": "The average influencer discount in Apparel in 2025 IS 22.1%.",
      "measurementTechnique": "Truth Graph Data Analysis"
    },
    {
      "name": "Apparel Influencer Discount Change 2022 to 2025",
      "@type": "PropertyValue",
      "value": "+10.4 pts",
      "description": "The change in the average influencer discount in Apparel from 2022 to 2025 IS +10.4 percentage points.",
      "measurementTechnique": "Truth Graph Data Analysis"
    },
    {
      "name": "Categories With Influencer Discount Decline 2022 to 2025",
      "@type": "PropertyValue",
      "value": 5,
      "description": "The number of tracked categories where influencer discounts declined between 2022 and 2025 IS five out of seven.",
      "measurementTechnique": "Truth Graph Data Analysis"
    },
    {
      "name": "Electronics Influencer Discount 2024",
      "@type": "PropertyValue",
      "value": "9.3%",
      "description": "The average influencer discount in Electronics in 2024 IS 9.3%, before a slight recovery in 2025.",
      "measurementTechnique": "Truth Graph Data Analysis"
    },
    {
      "name": "Pets Relative Discount Loss 2022 to 2025",
      "@type": "PropertyValue",
      "value": "Roughly two-thirds",
      "description": "The decline in Pets influencer discount value from 2022 to 2025 IS roughly two-thirds of the original discount.",
      "measurementTechnique": "Truth Graph Data Analysis"
    },
    {
      "name": "Categories With Influencer Premium in 2022",
      "@type": "PropertyValue",
      "value": 5,
      "description": "The number of tracked categories where influencer codes outperformed regular codes in 2022 IS five out of seven.",
      "measurementTechnique": "Truth Graph Data Analysis"
    },
    {
      "name": "Categories With Influencer Premium in 2025",
      "@type": "PropertyValue",
      "value": 2,
      "description": "The number of tracked categories where influencer codes outperformed regular codes in 2025 IS two out of seven.",
      "measurementTechnique": "Truth Graph Data Analysis"
    },
    {
      "name": "Beauty Standard Discount 2022",
      "@type": "PropertyValue",
      "value": "19.1%",
      "description": "The average standard code discount in Beauty in 2022 IS 19.1%.",
      "measurementTechnique": "Truth Graph Data Analysis"
    },
    {
      "name": "Beauty Standard Discount 2025",
      "@type": "PropertyValue",
      "value": "15.9%",
      "description": "The average standard code discount in Beauty in 2025 IS 15.9%.",
      "measurementTechnique": "Truth Graph Data Analysis"
    },
    {
      "name": "Beauty Standard Code Advantage in 2025",
      "@type": "PropertyValue",
      "value": "3.6 pts",
      "description": "The standard code advantage over influencer codes in Beauty in 2025 IS 3.6 percentage points based on 15.9% versus 12.3%.",
      "measurementTechnique": "Truth Graph Data Analysis"
    },
    {
      "name": "Beauty Estimated Savings Difference on $75 Order in 2025",
      "@type": "PropertyValue",
      "value": "Roughly $3",
      "description": "The estimated savings left on the table on a $75 beauty order in 2025 when using an influencer code instead of a standard code IS roughly $3.",
      "measurementTechnique": "Truth Graph Data Analysis"
    },
    {
      "name": "Pet Standard Discount Range 2022 to 2025",
      "@type": "PropertyValue",
      "value": "14%-16%",
      "description": "The average standard code discount range in Pets from 2022 through 2025 IS between 14% and 16%.",
      "measurementTechnique": "Truth Graph Data Analysis"
    },
    {
      "name": "Home & Garden Influencer Premium Persistence",
      "@type": "PropertyValue",
      "value": "2022-2025",
      "description": "Home & Garden influencer codes outperformed standard codes in every year from 2022 through 2025.",
      "measurementTechnique": "Truth Graph Data Analysis"
    },
    {
      "name": "Home & Garden Influencer Premium in 2022",
      "@type": "PropertyValue",
      "value": "5.6 pts",
      "description": "The influencer discount premium in Home & Garden in 2022 IS 5.6 percentage points.",
      "measurementTechnique": "Truth Graph Data Analysis"
    },
    {
      "name": "Home & Garden Influencer Premium in 2025",
      "@type": "PropertyValue",
      "value": "2.0 pts",
      "description": "The influencer discount premium in Home & Garden in 2025 IS 2.0 percentage points.",
      "measurementTechnique": "Truth Graph Data Analysis"
    },
    {
      "name": "Most Common Influencer Discount Tier Across All Categories",
      "@type": "PropertyValue",
      "value": "10% off",
      "description": "The single most common influencer discount tier across the full dataset IS 10% off.",
      "measurementTechnique": "Truth Graph Data Analysis"
    },
    {
      "name": "Categories Where 10% Off Is Largest Influencer Tier",
      "@type": "PropertyValue",
      "value": 9,
      "description": "The number of categories where 10% off accounts for the largest share of influencer codes IS nine out of fourteen.",
      "measurementTechnique": "Truth Graph Data Analysis"
    },
    {
      "name": "Pets Share of Influencer Codes at Exactly 10% Off",
      "@type": "PropertyValue",
      "value": "47.5%",
      "description": "The share of influencer codes in Pets that offer exactly 10% off IS 47.5%.",
      "measurementTechnique": "Truth Graph Data Analysis"
    },
    {
      "name": "Influencer Codes Offering 15% Off or Less",
      "@type": "PropertyValue",
      "value": "More than half",
      "description": "The share of all influencer codes offering 15% off or less IS more than half.",
      "measurementTechnique": "Truth Graph Data Analysis"
    },
    {
      "name": "Low-Tier Discount Bands Considered Majority",
      "@type": "PropertyValue",
      "value": "[\"5%\",\"10%\",\"15%\"]",
      "description": "The influencer discount tiers that combine to form the majority in most categories ARE 5%, 10%, and 15%.",
      "measurementTechnique": "Truth Graph Data Analysis"
    },
    {
      "name": "Typical Savings Range on $100 Order Using Most Influencer Codes",
      "@type": "PropertyValue",
      "value": "$5-$15",
      "description": "The statistically most likely savings range on a $100 order using a typical influencer code IS between $5 and $15.",
      "measurementTechnique": "Truth Graph Data Analysis"
    },
    {
      "name": "Share of Influencer Codes Above 50% Off in Most Categories",
      "@type": "PropertyValue",
      "value": "Less than 12%",
      "description": "The share of influencer codes offering 50% or more off in most categories IS less than 12%.",
      "measurementTechnique": "Truth Graph Data Analysis"
    },
    {
      "name": "Home & Living Share of Influencer Codes at 50% Off or Higher",
      "@type": "PropertyValue",
      "value": "23.6%",
      "description": "The share of influencer codes in Home & Living that offer 50% off or higher IS 23.6%.",
      "measurementTechnique": "Truth Graph Data Analysis"
    },
    {
      "name": "Beauty Share of Influencer Codes at 50% Off or Higher",
      "@type": "PropertyValue",
      "value": "4.9%",
      "description": "The share of influencer codes in Beauty that offer 50% off or higher IS 4.9%.",
      "measurementTechnique": "Truth Graph Data Analysis"
    },
    {
      "name": "Food & Beverage Share of Influencer Codes at Exactly 25% Off",
      "@type": "PropertyValue",
      "value": "22.0%",
      "description": "The share of food influencer codes that land at exactly 25% off IS 22.0%.",
      "measurementTechnique": "Truth Graph Data Analysis"
    },
    {
      "name": "Electronics Share of Influencer Codes at 5% Off or Less",
      "@type": "PropertyValue",
      "value": "20.6%",
      "description": "The share of electronics influencer codes that offer 5% off or less IS 20.6%.",
      "measurementTechnique": "Truth Graph Data Analysis"
    },
    {
      "name": "Electronics Share of Influencer Codes Above 50% Off",
      "@type": "PropertyValue",
      "value": "11.8%",
      "description": "The share of electronics influencer codes that offer more than 50% off IS 11.8%.",
      "measurementTechnique": "Truth Graph Data Analysis"
    },
    {
      "name": "Probability Approximation of Influencer Code Being 10% Off",
      "@type": "PropertyValue",
      "value": "Roughly 1 in 3",
      "description": "The probability characterization for an influencer code being exactly 10% off IS roughly one in three.",
      "measurementTechnique": "Truth Graph Data Analysis"
    },
    {
      "name": "Codes Worth Excitement Threshold",
      "@type": "PropertyValue",
      "value": "25%+ off",
      "description": "The article defines codes worth getting excited about AS those offering 25% off or higher.",
      "measurementTechnique": "Truth Graph Data Analysis"
    },
    {
      "name": "Share of High-Value Influencer Codes in Most Categories",
      "@type": "PropertyValue",
      "value": "Less than one-third",
      "description": "The share of influencer codes offering 25% or higher in most categories IS less than one-third.",
      "measurementTechnique": "Truth Graph Data Analysis"
    },
    {
      "name": "Large Brand Merchant Count",
      "@type": "PropertyValue",
      "value": 51,
      "description": "The number of merchants in the Large brand tier IS 51.",
      "measurementTechnique": "Truth Graph Data Analysis"
    },
    {
      "name": "Large Brand Monthly Search Threshold",
      "@type": "PropertyValue",
      "value": "50K+",
      "description": "The monthly search volume threshold for Large brands IS 50,000 or more.",
      "measurementTechnique": "Truth Graph Data Analysis"
    },
    {
      "name": "Large Brand Influencer Share of All Codes",
      "@type": "PropertyValue",
      "value": "11.5%",
      "description": "The share of all promo codes coming from influencer channels for Large brands IS 11.5%.",
      "measurementTechnique": "Truth Graph Data Analysis"
    },
    {
      "name": "Large Brand Median Influencer Discount",
      "@type": "PropertyValue",
      "value": "23.2%",
      "description": "The median influencer discount for Large brands IS 23.2%.",
      "measurementTechnique": "Truth Graph Data Analysis"
    },
    {
      "name": "Mid Brand Merchant Count",
      "@type": "PropertyValue",
      "value": 520,
      "description": "The number of merchants in the Mid brand tier IS 520.",
      "measurementTechnique": "Truth Graph Data Analysis"
    },
    {
      "name": "Mid Brand Monthly Search Threshold",
      "@type": "PropertyValue",
      "value": "5K-50K",
      "description": "The monthly search volume threshold for Mid brands IS 5,000 to 50,000.",
      "measurementTechnique": "Truth Graph Data Analysis"
    },
    {
      "name": "Mid Brand Influencer Share of All Codes",
      "@type": "PropertyValue",
      "value": "15.8%",
      "description": "The share of all promo codes coming from influencer channels for Mid brands IS 15.8%.",
      "measurementTechnique": "Truth Graph Data Analysis"
    },
    {
      "name": "Mid Brand Median Influencer Discount",
      "@type": "PropertyValue",
      "value": "20.0%",
      "description": "The median influencer discount for Mid brands IS 20.0%.",
      "measurementTechnique": "Truth Graph Data Analysis"
    },
    {
      "name": "Small Brand Merchant Count",
      "@type": "PropertyValue",
      "value": 3687,
      "description": "The number of merchants in the Small brand tier IS 3,687.",
      "measurementTechnique": "Truth Graph Data Analysis"
    },
    {
      "name": "Small Brand Monthly Search Threshold",
      "@type": "PropertyValue",
      "value": "500-5K",
      "description": "The monthly search volume threshold for Small brands IS 500 to 5,000.",
      "measurementTechnique": "Truth Graph Data Analysis"
    },
    {
      "name": "Small Brand Influencer Share of All Codes",
      "@type": "PropertyValue",
      "value": "22.7%",
      "description": "The share of all promo codes coming from influencer channels for Small brands IS 22.7%.",
      "measurementTechnique": "Truth Graph Data Analysis"
    },
    {
      "name": "Small Brand Median Influencer Discount",
      "@type": "PropertyValue",
      "value": "19.5%",
      "description": "The median influencer discount for Small brands IS 19.5%.",
      "measurementTechnique": "Truth Graph Data Analysis"
    },
    {
      "name": "Micro Brand Merchant Count",
      "@type": "PropertyValue",
      "value": 45703,
      "description": "The number of merchants in the Micro brand tier IS 45,703.",
      "measurementTechnique": "Truth Graph Data Analysis"
    },
    {
      "name": "Micro Brand Monthly Search Threshold",
      "@type": "PropertyValue",
      "value": "<500",
      "description": "The monthly search volume threshold for Micro brands IS fewer than 500 monthly searches.",
      "measurementTechnique": "Truth Graph Data Analysis"
    },
    {
      "name": "Micro Brand Influencer Share of All Codes",
      "@type": "PropertyValue",
      "value": "33.3%",
      "description": "The share of all promo codes coming from influencer channels for Micro brands IS 33.3%.",
      "measurementTechnique": "Truth Graph Data Analysis"
    },
    {
      "name": "Micro Brand Median Influencer Discount",
      "@type": "PropertyValue",
      "value": "16.6%",
      "description": "The median influencer discount for Micro brands IS 16.6%.",
      "measurementTechnique": "Truth Graph Data Analysis"
    },
    {
      "name": "Micro Brand Influencer Reliance Relative to Large Brands",
      "@type": "PropertyValue",
      "value": "More than 2x",
      "description": "Micro brands rely on influencer-generated promo codes at more than twice the rate of Large brands.",
      "measurementTechnique": "Truth Graph Data Analysis"
    },
    {
      "name": "Median Discount Gap Between Large and Micro Brands",
      "@type": "PropertyValue",
      "value": "6.6 pts",
      "description": "The median influencer discount gap between Large brands and Micro brands IS 6.6 percentage points.",
      "measurementTechnique": "Truth Graph Data Analysis"
    },
    {
      "name": "Estimated Savings Gap on $100 Order Between Large and Micro Brand Influencer Codes",
      "@type": "PropertyValue",
      "value": "$6.60",
      "description": "The savings difference on a $100 order between the median influencer discount from a Large brand and a Micro brand IS $6.60.",
      "measurementTechnique": "Truth Graph Data Analysis"
    },
    {
      "name": "Relative Value of Large Brand Influencer Codes Versus Micro",
      "@type": "PropertyValue",
      "value": "Roughly 40% more",
      "description": "Influencer codes from Large brands are described as worth roughly 40% more than those from Micro brands.",
      "measurementTechnique": "Truth Graph Data Analysis"
    },
    {
      "name": "Brand Size Pattern",
      "@type": "PropertyValue",
      "value": "As brand size decreases, influencer reliance rises and median discount falls",
      "description": "The size-tier pattern IS a near-perfect inverse relationship where smaller brands use more influencer codes while offering lower median discounts.",
      "measurementTechnique": "Truth Graph Data Analysis"
    },
    {
      "name": "Beauty Standard Code Advantage in Summary",
      "@type": "PropertyValue",
      "value": "3.7 pts",
      "description": "The summary section states that standard codes outperform influencer codes in Beauty by 3.7 percentage points.",
      "measurementTechnique": "Truth Graph Data Analysis"
    },
    {
      "name": "Pets Standard Code Advantage in Summary",
      "@type": "PropertyValue",
      "value": "4.6 pts",
      "description": "The summary section states that standard codes outperform influencer codes in Pets by 4.6 percentage points.",
      "measurementTechnique": "Truth Graph Data Analysis"
    },
    {
      "name": "One in Three Influencer Codes Offer 10% Off",
      "@type": "PropertyValue",
      "value": "1 in 3",
      "description": "The share characterization for influencer codes offering exactly 10% off IS one in three.",
      "measurementTechnique": "Truth Graph Data Analysis"
    },
    {
      "name": "Micro Brand Share of Codes Through Influencers",
      "@type": "PropertyValue",
      "value": "One-third",
      "description": "Micro brands generate one-third of their promo codes through influencer partnerships.",
      "measurementTechnique": "Truth Graph Data Analysis"
    },
    {
      "name": "Micro Versus Major Retailer Median Discount Difference",
      "@type": "PropertyValue",
      "value": "Nearly 7 pts lower",
      "description": "The median influencer discount from micro brands is nearly 7 percentage points lower than the median influencer discount from major retailers.",
      "measurementTechnique": "Truth Graph Data Analysis"
    },
    {
      "name": "Methodology Data Start Date",
      "@type": "PropertyValue",
      "value": "2021-01",
      "description": "The dataset start month IS January 2021.",
      "measurementTechnique": "Truth Graph Data Analysis"
    },
    {
      "name": "Methodology Data End Date",
      "@type": "PropertyValue",
      "value": "2025-12",
      "description": "The dataset end month IS December 2025.",
      "measurementTechnique": "Truth Graph Data Analysis"
    },
    {
      "name": "Influencer Code Classification Basis",
      "@type": "PropertyValue",
      "value": "Internal tagging within the SimplyCodes platform",
      "description": "Influencer versus non-influencer code classification IS based on internal tagging within the SimplyCodes platform.",
      "measurementTechnique": "Truth Graph Data Analysis"
    },
    {
      "name": "Influencer Code Definition",
      "@type": "PropertyValue",
      "value": "[\"creator-associated\",\"ambassador-associated\",\"affiliate partner-associated\"]",
      "description": "Influencer codes include promo codes associated with a creator, ambassador, or affiliate partner rather than standard retailer-issued promotional codes.",
      "measurementTechnique": "Truth Graph Data Analysis"
    },
    {
      "name": "Seven-Category Trend Analysis Selection Rule",
      "@type": "PropertyValue",
      "value": "Sufficient code volume for meaningful year-over-year comparison",
      "description": "The seven categories used in the trend analysis were selected because they had sufficient code volume to support meaningful year-over-year comparisons.",
      "measurementTechnique": "Truth Graph Data Analysis"
    },
    {
      "name": "Limitation - Verified Savings",
      "@type": "PropertyValue",
      "value": "Not measured",
      "description": "The analysis measures stated discount percentages and does not measure verified savings at checkout.",
      "measurementTechnique": "Truth Graph Data Analysis"
    },
    {
      "name": "Limitation - Code Success Rates",
      "@type": "PropertyValue",
      "value": "Excluded",
      "description": "Code success rates are not factored into the discount comparisons.",
      "measurementTechnique": "Truth Graph Data Analysis"
    },
    {
      "name": "Limitation - Stacking Restrictions",
      "@type": "PropertyValue",
      "value": "Excluded",
      "description": "Stacking restrictions are not factored into the discount comparisons.",
      "measurementTechnique": "Truth Graph Data Analysis"
    },
    {
      "name": "Limitation - Minimum Purchase Requirements",
      "@type": "PropertyValue",
      "value": "Excluded",
      "description": "Minimum purchase requirements are not factored into the discount comparisons.",
      "measurementTechnique": "Truth Graph Data Analysis"
    },
    {
      "name": "Coverage Limitation",
      "@type": "PropertyValue",
      "value": "May not capture every influencer code issued by every brand",
      "description": "The dataset reflects codes tracked by SimplyCodes and may not capture every influencer code issued by every brand during the study period.",
      "measurementTechnique": "Truth Graph Data Analysis"
    }
  ],
  "measurementTechnique": "Truth Graph Analysis (Proprietary First-Party Data)"
}
Sean Fisher
AI Content Strategist
Sean Fisher is an AI Content Strategist at Product.ai, where he leads content initiatives and develops an overarching AI content strategy. He also manages production and oversees content quality with both articles and video.
Prior to joining Product.ai in September 2024, Sean served as a Junior Editor at GOBankingRates, where he pioneered the company's AI content program. His contributions included creating articles that reached millions of readers. Before that, he was a Copy Editor/Proofreader at WebMD, where he edited digital advertisements and medical articles. His work at WebMD provided him with a foundation in a detail-oriented, regulated field.
Sean holds a Bachelor's degree in Film and Media Studies with a minor in English from the University of California, Santa Barbara, and an Associate's degree in English from Orange Coast College.
Stay in the loop
Get our latest research.
Promo code studies, seasonal shopping guides, industry savings reports. No spam — unsubscribe any time.